
Ko Samui air quality map
Live air pollution map of Ko Samui • 287.7K Followers • 02:00, Jul 25 Local time

Stations
Clean Air Facilities
Contributors
Government
0Diplomatic
0Non-profit
0Education
0Corporate
1Healthcare
0Hospitality
0Individual
3Top contributors in Ko Samui
Who is sharing outdoor air quality data in Ko Samui?
Featured station
Discover some of the best station installation in Ko Samui
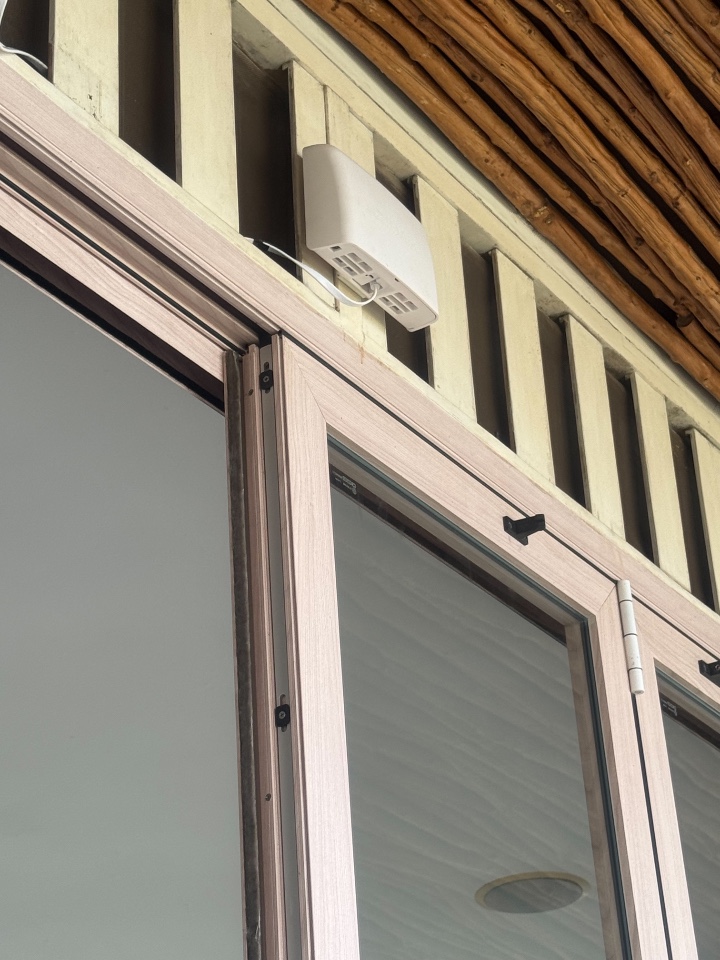
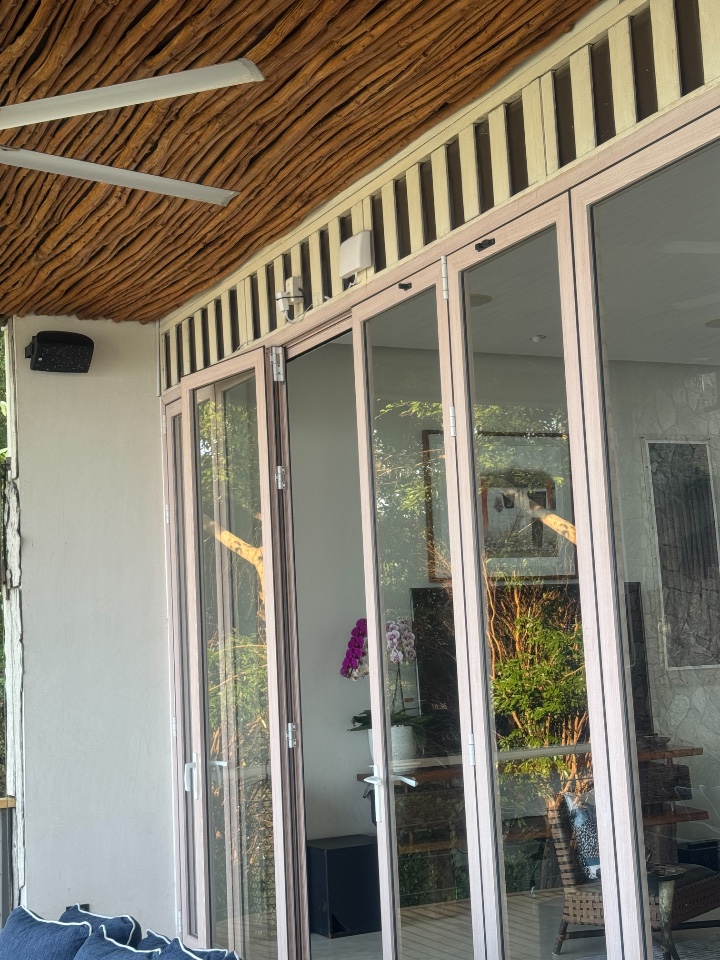
Station gallery

Kaya Samui Bophut Hills Outdoor, Ko Samui
17
Newest stations deployed in Ko Samui
AQI⁺ station ranking


Learn more about global air quality


Learn more about air pollution in Ko Samui
What is the air quality index of Ko Samui?
Ko Samui is sometimes known as Koh Samui or even just Samui by the local Thai people. It is an island situated off the east coast of Thailand and is part of the Surat Thani province. It is the second largest island in Thailand falling behind Phuket which is the largest. Its population was approximately 70,000 in 2017, but this figure increases vastly due to its popularity with tourists. In 2018 almost 3 million tourists made Ko Samui their destination.
In December 2020 the air quality index registered a figure of 17 US AQI and a concentration level of the pollutant PM2.5 as 4.1 µg/m³. Both these figures classify the air quality as “Good” according to the recommended levels suggested by the World Health Organisation (WHO). At the time of writing, there are no ground-level monitoring stations on Ko Samui so these figures are produced using satellite information.
What are the main sources of air pollution in Ko Samui?
On the west coast of the island is the port town of Nathon where two of the islands major piers can be found. It is a very important port for the local fishing industry and it also serves as the main gateway to the island for vehicles and goods which are shipped over from the mainland. As Ko Samui becomes less dependent on its coconut product industry and increase in tourism, commercial activity is increasing in the northeast where the airport is located. In 2009 the airport handled over 1.3 million passengers and almost 20,000 aircraft take-offs and landings.
Additionally there is a public bus service which covers all parts of the island from its new terminus in the northern suburbs of Nathon. Songthaewas are taxis which have been adapted from pick-up trucks. The rear section is partially covered and bench seats run at either side of the rear bed. They operate in a similar way to the buses but ply the smaller, quieter routes in and around the city. They usually have a fixed fee system in operation.
The main cause of pollution in Ko Samui is not self-created, instead it suffers from the effects of its neighbour, Sumatra, burning its forests in a slash and burn culture.
Is the air quality in Ko Samui getting better or worse?
On 24th January 2020 which is Wai Day and part of the Chinese New Year, Thai-Chinese people who live on Ko Samui bring offerings to various gods and other deities. Firecrackers normally play a very large part in these celebrations and have been traditionally set off for generations. Many do not realise that they are very bad for the air as they release contaminants of PM2.5 and Black Soot into the atmosphere. A very novel way to reduce the effects of this source of air pollution was taken by a restaurateur of Chinese descent. Instead of using firecrackers to make the popping noise, he strung more than 200 red balloons together at one side of a piece of apparatus containing sharp nails. When given the signal, his staff pulled on the string attached to the balloons and began to pull them through the box. The popping noise emitted by the balloons bursting was amplified by the box so it sounded just as loud as firecrackers but without any air pollution.
The increasing number of tourists will encourage more traffic use whether it’s the boats or aeroplanes that bring them to the island or the pleasure boats and songthaewas that are used whilst they are there.
What are the health effects of Ko Samui’s polluted air?
It is no secret that the air we breathe is polluted and the air around Ko Samui is no different. Even the ambient air inside our homes contains many toxic chemicals inadvertently introduced by the homeowner. There are three types of chemical pollutants that are particularly harmful: flame retardants, phthalates and PFAs. Flame retardants, so often used in the manufacture of children’s clothing can potentially hinder their development. Phthalates can damage fertility and PFAS can influence pregnancy.
Think again about plastic pollution, microplastics with pieces under 5 millimetres in length and nanoplastics with pieces under 0.001 millimetre are a result of plastic degenerating due to many influencing factors. These microscopic particles eventually become airborne where they can easily be breathed in. As yet, scientists are still analysing the effects that ingested plastic particles have on the body.
The effect of air pollution has on the lungs depends on several parameters, the general state of health of the individual, the concentration levels of the pollutants and the length of exposure to the contaminated air.
A person with pre-existing respiratory problems will be affected by low quality air much sooner that a heathy strong person would. Higher levels can induce an asthma attack or COPD flare-up.
Research suggests that long-term exposure to polluted air can be the cause of some lung conditions. There is strong evidence linking cancer to outdoor air quality and the rise in the number of people, particularly children, who now are suffering from an increased number of asthma attacks.
What can be done to improve Ko Samui’s air quality?
The poor air quality on Ko Samui could be improved by the reduction of motor vehicles on the roads, particularly the older vehicles that do not have modern technology that controls the emissions from the engine. The banning of inferior grade fuel would also help as it is quite common to add cheap hydrocarbons to fuel to extend its volume.
The local government could phase out the old style buses that use diesel as a fuel and introduce cleaner buses than either use sustainable fuels or are electric powered.
Ships, whilst docked in harbour should be compelled to use clean fuel and to keep the use of their engines to a minimum whilst there.
Because of its coastal location, Ko Samui does not have as big a problem with air pollution as other Thai towns and cities. As with most coastal areas, the prevailing winds off the sea keep the air cleaner by blowing what pollutants there are, away.


