
Colombo air quality map
Live air pollution map of Colombo • 122.9K Followers • 09:30, Jul 26 Local time


Stations
Clean Air Facilities
Contributors
Government
0Diplomatic
0Non-profit
0Education
3Corporate
1Healthcare
0Hospitality
0Individual
0Top contributors in Colombo
Who is sharing outdoor air quality data in Colombo?
Featured station
Discover some of the best station installation in Colombo
Station gallery

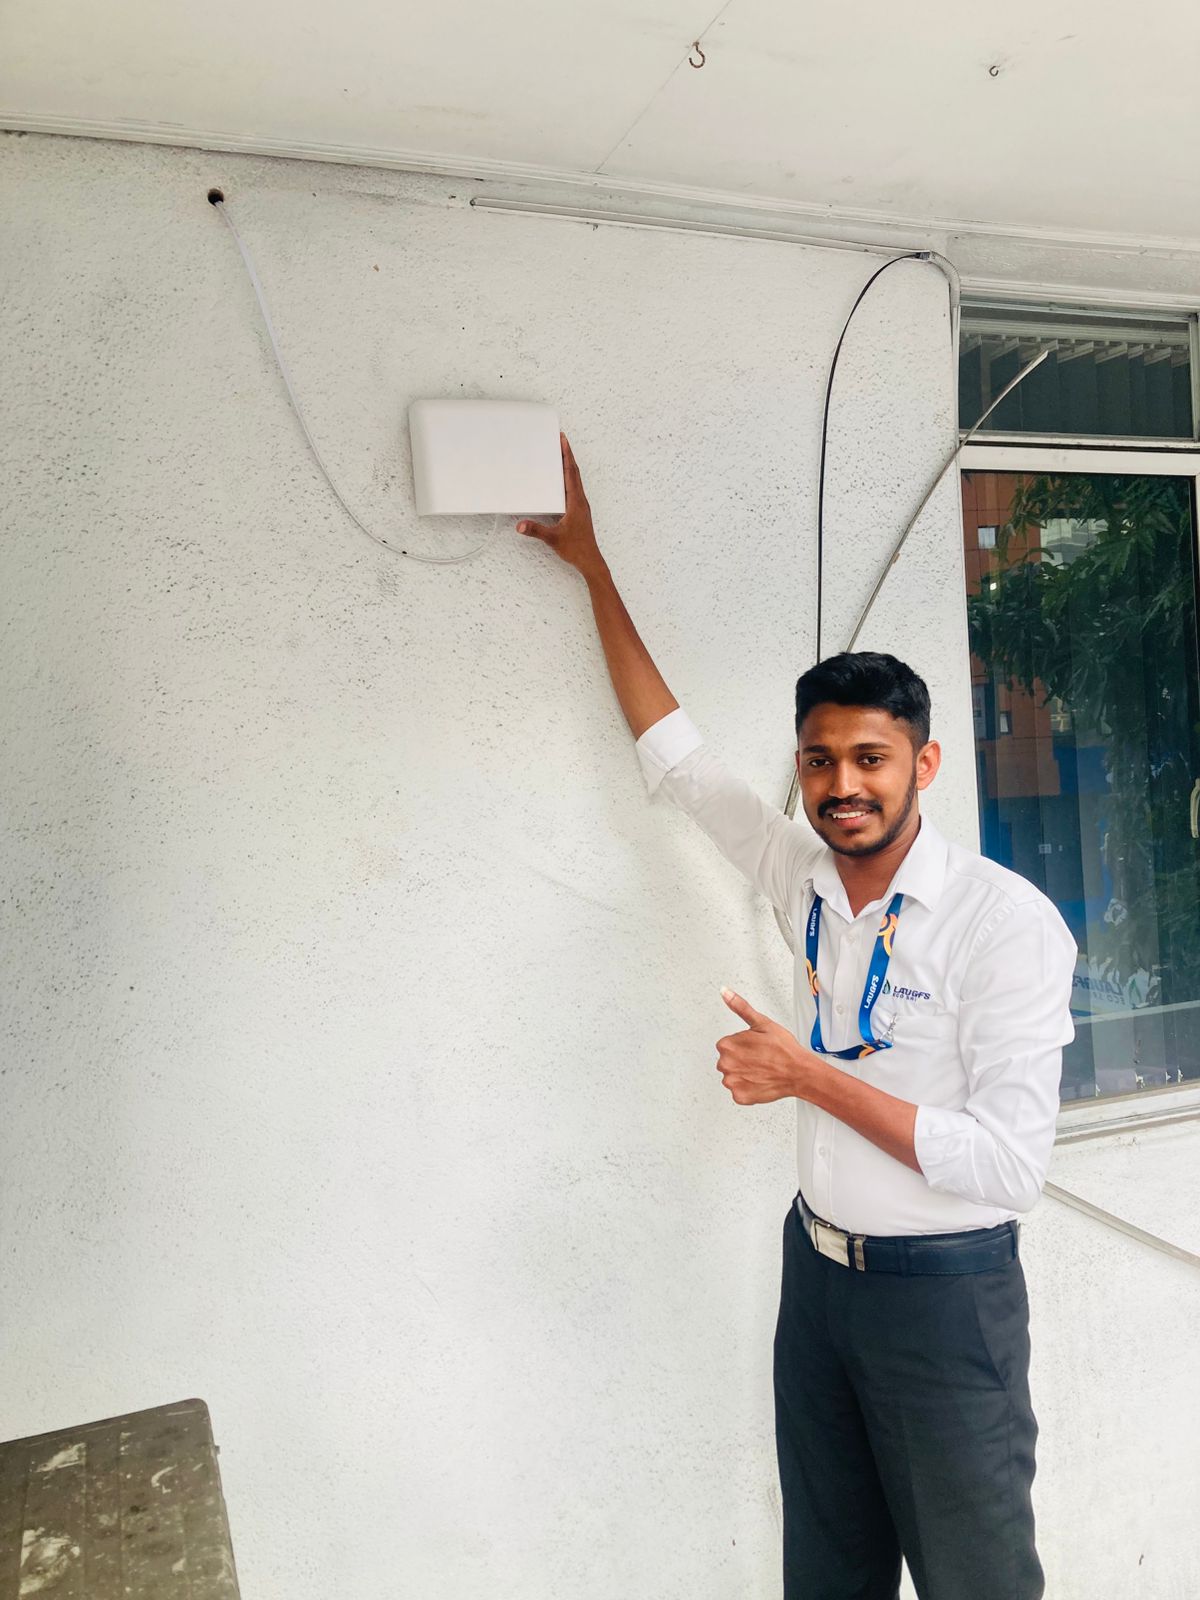
LAUGFS ECO SRI - Head Office Kirulapone, Colombo
50
Newest stations deployed in Colombo
AQI⁺ station ranking


Learn more about global air quality


Learn more about air pollution in Colombo
What is the air quality index of Colombo?
Colombo is the largest city on the west coast of the island of Sri Lanka and acts as its commercial capital city. In 2011, the population stood at 5,648,000 people. At the end of 2020, according to figures released by the reputable Swiss company IQAir.com, the quality of air In Colombo was “Good” with a figure of 13 US AQI. The concentration of the main pollutant PM2.5 was 3 µg/m³. These numbers follow the guidelines as suggested by the World Health Organisation (WHO). With such relatively low numbers, there is no reason why the doors and windows can be opened to bring clean, fresh air indoors, or outdoor activities could be enjoyed.
What are the main sources of air pollution in Colombo?
Vehicles are the largest cause of air pollution with about 70 per cent of air pollution in Colombo is caused by vehicle emissions. Many of these vehicles tend to be older ones, some even more than 15 years old. At that age, they have not been fitted with the latest technology that filters the exhaust fumes and prevents a lot of the harmful gases entering the environment. Other countries, including India, are considering banning these old vehicles from the city centres.
It is also caused by the burning of garbage in homes and factories and by solid waste accumulated from factories, mines and large cities.
Is the air quality in Colombo getting better or worse?
According to data recently obtained, air pollution has increased in most parts of the country except in the south, including Colombo, Kandy, Puttalam, Vavuniya and Jaffna.
As the impact of COVID 19 increased in Sri Lanka, various restrictions were imposed there. As a result, environmentalists say the current rise in air pollution is a cause for concern, although the rate of air pollution should have been reduced as traffic has decreased.
The report said that air pollution within the country may have increased due to the prevailing windy weather in the areas surrounding Sri Lanka. According to the Air Visual website, the increase in air pollution is due to the entry of polluted air over the Indian subcontinent into the Sri Lankan atmosphere. The change in air patterns has moved the polluted air from over the Indian subcontinent to Sri Lanka.
Our atmosphere is essential to support life of all types. It contains 78.09 per cent nitrogen, 20.95 per cent oxygen, 0.93 per cent argon, carbon dioxide and small quantities of some other gases. The most essential being oxygen as it is vital to existence. Contaminants such as inorganic and organic chemicals in the atmosphere come and mix in solid, liquid, and gaseous states.
What are the health effects of Colombo’s polluted air?
Poor air can kill organisms, including humans. Ozone (O3) pollution causes the following diseases in humans: respiratory disease, heart disease, throat irritation, chest pains and nasal congestion.
The environment too can suffer because of pollutants in the air. Environmental pollution is widespread in the industrialised world. This results in the following effects: Pollution exposure to greenhouse gases leads to global warming that affects the ecosystem in many ways. The soil becomes infertile and the plants become unfit to grow. This can affect other organisms in the food chain. The leaves of the trees and plants become covered with dust which prevents their ability to photosynthesise nitrogen dioxide into oxygen.
Acid rain, caused by gases such as sulphur and nitrogen oxides emitted from factories, not only increase the acidity of the soil but also cause damage to plants, leaf fall, and damage to aquatic organisms in ponds and rivers.
It has been reported that children, the elderly, pregnant women and those with pre-existing respiratory problems may have difficulty breathing due to this air pollution and others may not be affected. The Sri Lankan Ministry of Health has requested that the health department investigate the health problems caused by air pollution and continue to wear face masks to prevent health problems. Other advice is to limit the amount of time spent outdoors when the air is of poor quality. Closing doors and windows will prevent dirty air from entering the house.
If you inhale any amount of polluted air directly, the airways will be affected. This is a proven fact. Bronchial infections can lead to lung and respiratory problems in the next stage. In particular, lifelong respiratory problems such as bronchitis, asthma, COPD, and allergy problems are more likely to occur. It is noteworthy that all of these problems can shorten lifespan.
What can be done to improve Colombo’s air quality?
The expansion of the public transport network and the active encouragement of its use are needed to reduce the number of private cars on the streets of the capital. It is a proven fact that when mobile air monitoring stations are set up near busy road junctions, the figures they produce are evidence alone as to where the polluted air comes from. In hotter countries, drivers are loathed to turn off their engines whilst queuing as it also turns off the air conditioning system and the interior soon heats up. Modern motorbikes turn off their engine automatically if forward movement is no longer detected.
Exhaust emissions can be checked periodically and adjusted if necessary. Proper maintenance of the vehicle will avoid damage. During vehicle production, the government may assist in the modification of engine parts to reduce the amount of carbon dioxide given off into the air. Travelling on public transport as much as possible will greatly reduce fuel shortages, cleanliness and road congestion.
Factories should have filters and cleaning systems fitted by law. When that is not the case, opposition groups should be formed to petition the government to make them comply. The government should take serious action against harmful factories. The Air Safety and Pollution Control Act provides for action to be taken against companies that cause pollution.
The planting of trees which naturally convert carbon dioxide into oxygen should be undertaken throughout cities, where possible. Cutting down trees for urban development increases toxic gases in the atmosphere, causing air pollution, including noise. Trees can help reduce noise and also block some of the prevailing winds.


