Krasnodar air quality map
Live air pollution map of Krasnodar
33.7K people follow this city
Full screen
Contributors
1
Stations
1
Contributors category
0
Government
0
Non-profit organization
0
Educational
0
Corporate
0
Individual
1
Anonymous
Most polluted air quality stations
| # | station | US AQI |
|---|---|---|
| 1 | Breeeth! - Arhitektora Petina | 59 |
community highlight
Krasnodar most followed contributors
Health Recommendations
| Sensitive groups should reduce outdoor exercise | |
| Close your windows to avoid dirty outdoor air GET A MONITOR | |
| Sensitive groups should wear a mask outdoors GET A MASK | |
| Sensitive groups should run an air purifier GET AN AIR PURIFIER |
Become a contributor
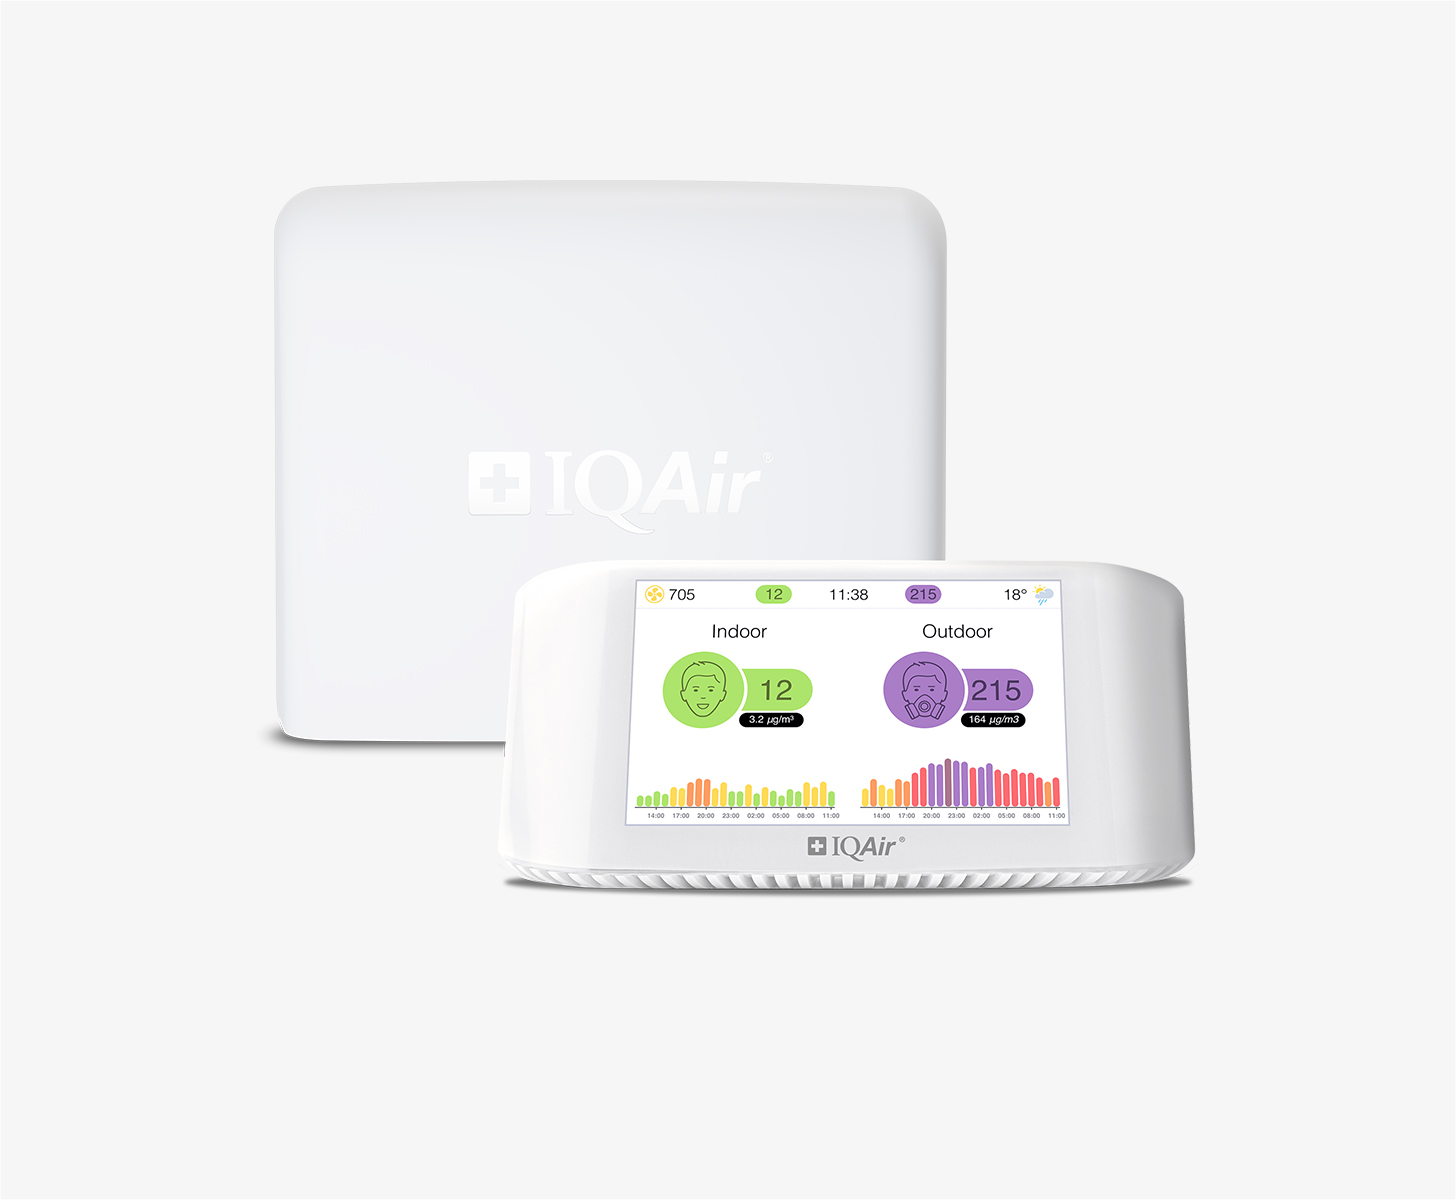
Get an AirVisual Outdoor and contribute to collecting millions of data points for the Krasnodar map to track local air pollution
Understand air pollution and protect yourself
Krasnodar MAP AIR QUALITY ANALYSIS AND STATISTICS
What information about air quality can be found on the air pollution map for Krasnodar?
The direct link to the air pollution map for Krasnodar can be found at the top of the main city page. By clicking anywhere on the map icon will open this new page filled with useful information about the air quality in that region.
When the new page is first seen, the viewer will notice the overall colour of the map. This is a direct reflection of the air quality at that time. In September 2022, it was an overall green colour which represents “Good” air quality. The full meaning behind all the colours used is explained in the legend at the foot of the page. The viewer will also notice some coloured discs dotted across the page. These represent the location of all the ground-level air monitoring stations in and around the city. In the centre of these discs is a number which is the US AQI reading. It is calculated by measuring the levels of six of the most prolific air pollutants found in the city air. These are usually Particulate Matter (PM2.5 and PM10), ozone, nitrogen dioxide, sulphur dioxide and carbon monoxide. The number is then used as a standard when comparing air quality in different cities across the globe. It is endorsed by the World Health Organisation (WHO).
Briefly looking back to the main page, it is seen that in September 2022, Krasnodar was enjoying a period of “Good” quality air with a US AQI reading of just 12. The main pollutant which was recorded was PM2.5 with a level of 3 µg/m³ which is below the suggested target figure of 5 µg/m³ as recommended by the WHO.
Scrolling further down the page, just below the map can be seen the number of stations that are providing all the necessary data regarding air quality. Currently, there is only one station that is controlled by an anonymous contributor.
Is there much more useful information about air quality on the air pollution map for Krasnodar?
In order to gain maximum benefits from the air pollution map for Krasnodar, it needs to be viewed in full-screen mode otherwise some of the information will remain obscured. At this large size, a drop-down box of four options appears on the far left-hand side of the screen. All of these options can be individually deactivated making it easier to study one by one.
The first option reveals the position of the ground-level air monitoring stations which are spread across the area. They carry a colour which is reflective of the air quality as well as a number. If any disc is selected, then a new page will open with more extensive details about that particular area of the city.
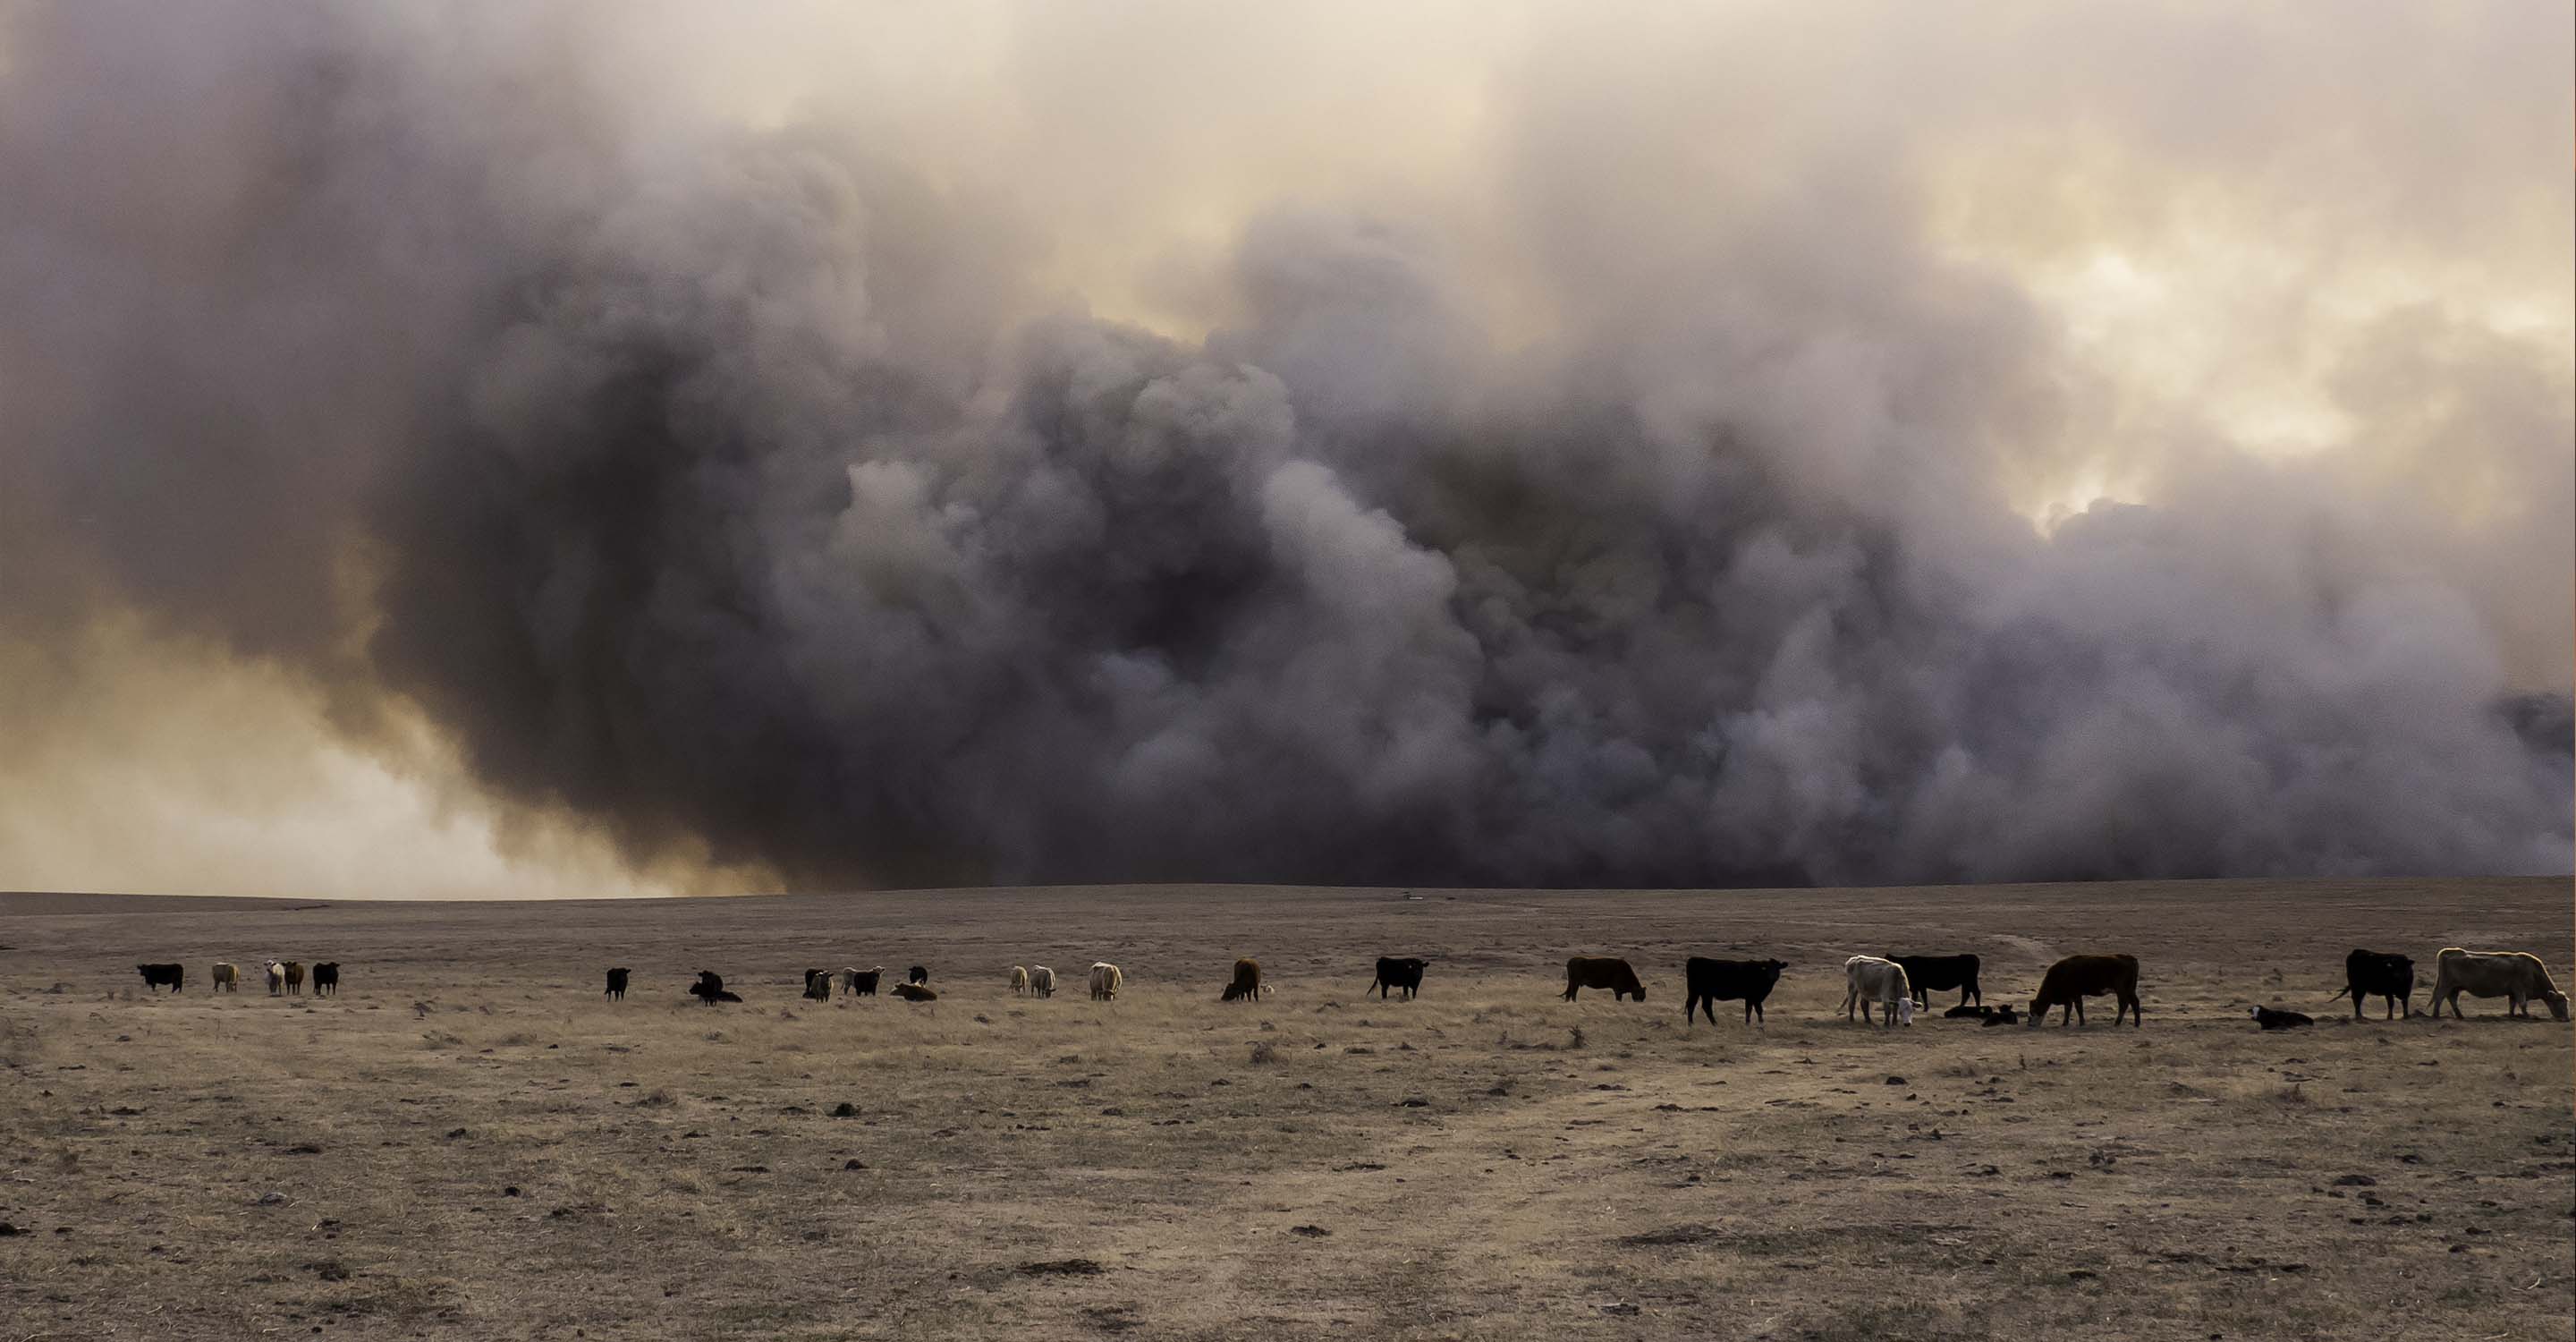
The next option shows the position of any fires that are burning in the vicinity. In September 2022, there were five fires in the south and south east. However, when option number four is consulted which shows the wind speed and direction, it was seen that the residual smoke would be blown away from the city due to the direction of the prevailing winds.
Option number three reveals the overall air quality of the area. The entire map takes on an overall colour which is indicative of the current air quality. It is currently green which tells the viewer that the quality is “Good”. If deactivated, the colour over the map will revert to a more subdued palette which many may find easier to understand.
Looking across to the far right-hand side of the screen can be seen a table which ranks world cities according to their levels of air pollution. A very useful addition when making comparisons!
Directly below the air pollution map for Krasnodar can be seen a table which ranks all the stations according to their levels of pollution. As there is only one station here, there is not much to look at. The station at Breeeth! - Arhitektora Petina is ranked as the most polluted but that has little significance as it is the only one.
Below this table is another which lists the stations according to the number of followers that each has, Breeeth! - Arhitektora Petina currently has over 13,000 followers.
Are areas of higher pollution visible on the air quality map for Krasnodar?
The easiest way to find the areas of high pollution in and around the city is to look directly beneath the air pollution map for Krasnodar where a table is printed which lists the stations according to their level of pollution.
Apart from the industrial zones which usually have elevated levels of air pollution because of their activities, the city centre can often show elevated levels because of the volume of traffic which uses the road network.
Can the source of the polluted air be seen on the air pollution map for Krasnodar?
The source of air pollution is not available from the air pollution map for Krasnodar, however, extensive research concludes that the increase in emissions of pollutants from mobile sources in recent years is due to an increase in the number of private transport (about 5% per year), most of which does not meet the requirements of standards, as well as an increase in the scale of cargo transhipment in seaports. The main contribution to air pollution is made by enterprises in the following industries: fuel, electric power, chemical and petrochemical, building materials and food producers.
PM2.5 is used as a benchmark on the air pollution map for Krasnodar, but what is it?
The mass concentration of PM2.5 is a key parameter for assessing air quality and its threat to human health. According to the standards of the World Health Organisation (WHO), the average annual level of PM2.5 should not exceed 10 µg/m³, and the average daily level should not exceed 25 µg/m³. The actual concentration of particles in the air is estimated by various environmental monitoring services around the world.
PM2.5 particles are also called the respirable, inhalable fraction. They are so small that they pass through biological barriers in our body: the nasal cavity, upper respiratory tract and bronchi. PM2.5, together with air, enters directly into the alveoli where gas exchange occurs between the lungs and blood vessels.
The smallest particles of PM2.5 during gas exchange can enter the blood. Therefore, they are associated with diseases not only of the respiratory system but also in the cardiovascular system.
Krasnodar air quality data attribution
1Contributor
 1 Anonymous contributor
1 station
Anonymous Contributor
1 Data source


