
Mumbai air quality map
Live air pollution map of Mumbai • 1.8M Followers • 07:30, Aug 02 Local time


Stations
Clean Air Facilities
Contributors
Government
1Diplomatic
0Non-profit
0Education
0Corporate
1Healthcare
0Hospitality
0Individual
3Top contributors in Mumbai
Who is sharing outdoor air quality data in Mumbai?
Featured station
Discover some of the best station installation in Mumbai
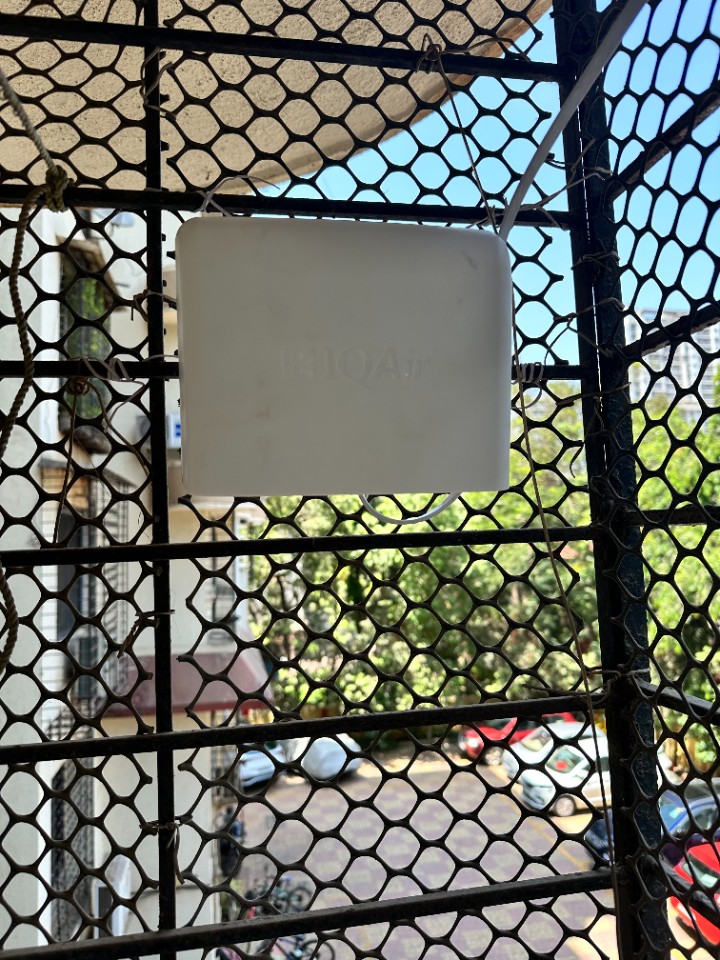
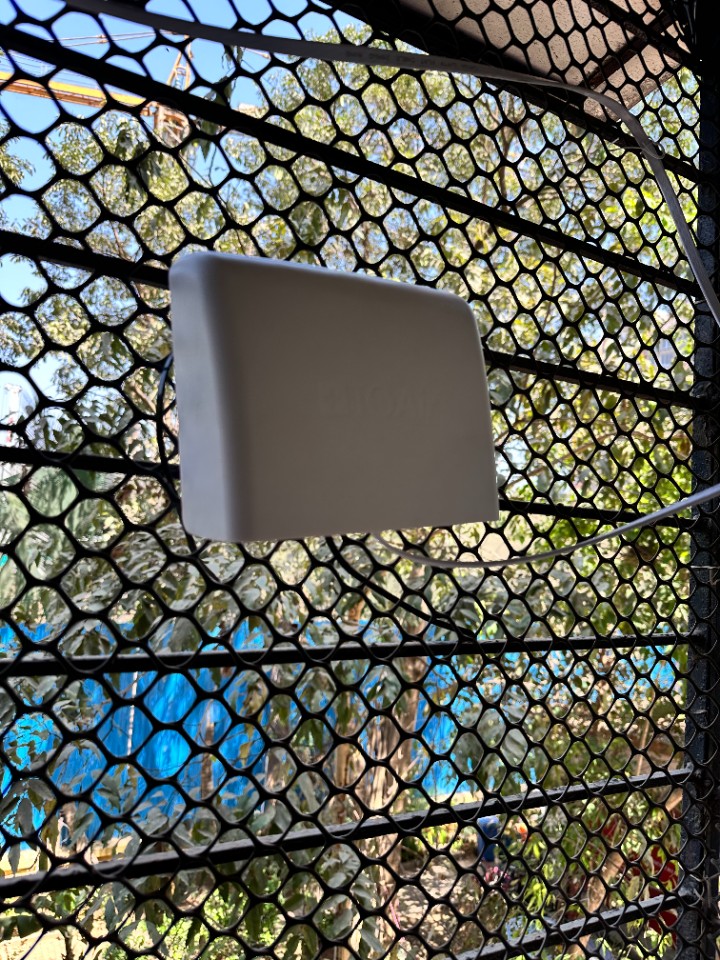

Station gallery

Borivali, Mumbai
75
Newest stations deployed in Mumbai
AQI⁺ station rankingNewest stations


Learn more about global air quality


Learn more about air pollution in Mumbai
Why is Mumbai so polluted?
In 2018, Greenpeace India ranked Mumbai as the 37th most polluted city in India. Having analysed data from 2013 to 2018 the Airpocalypse-IV report showed that for more than 52 days, the level of air pollution in Mumbai exceeded the safety standards of 60 micrograms per cubic metre (µg/m3) for the presence of PM10 particulate matter. This number of 162 µg/m3 for 2018, is three times the suggested national ambient air quality safety standard and eight times the international standard (20 µg/m3) recommended by the World Health Organization (WHO).
It seems that, like other major cities throughout the world, most of the pollution is caused by traffic and construction. 29 per cent of the airborne particulate matter comes from road and construction dust. This is followed by power plants which add 20 per cent to the PM levels. The main source of traffic contamination comes from the heavy duty vehicles which run on diesel.
Traffic congestion builds up due to delays caused by the construction and demolition of buildings within the city. As a direct result of these delays, the traffic often stands idle whilst waiting for the line to start moving again. All the while though, its engines are still running and pumping exhaust gases into the atmosphere. As a result of roads that are in bad condition, traffic moves at a slower speed and therefore stays within the city limits for longer than necessary.
It has been noticed that the areas within Mumbai which recorded the poorest AQI index have the largest number of registered vehicles. In 2019 the number of registered vehicles rose by 9.9 per cent bring the total to approximately 3.5 million.
What are the effects of air pollution in Mumbai?
In 2017, the air pollution in India accounted for 1.24 million deaths. 54 per cent was attributed to ambient air pollution and 46 per cent to household pollution caused by solid cooking fuels.
Particulate matter of PM10 and nitrogen dioxide (NO2) have been recorded as being the most critical pollutants with the greatest impact on health. Coughs, breathlessness, wheezing and colds as well as chronic obstructive pulmonary disease (COPD) and allergic rhinitis can be attributed to exposure to poor air quality. Nitrogen dioxide levels were recorded at four monitoring stations in Mumbai as being well over the WHO's safe limit of 40 µg/m³. In September 2019 this figure rose to levels between 50 µg/m³ and 69 µg/m³. With the increase of these diseases comes a rise in the financial health burden. It is estimated at US$ 113.08 million for a 50-μg/m3 increase in PM10, and INR 8723.59 million or US$ 218.10 million for a similar increase in NO2.
Can air pollution in Mumbai be reduced?
Primarily, people need to be made aware of the effects of breathing in polluted air because, only then can they start to take steps to alleviate the situation. The key factor in improving air quality is reducing emissions. In 2019 the Indian authorities launched the National Clean Air programme (NCAP) which aims to cut pollution in 102 of the most polluted cities by between 20 and 30 per cent by 2024. Under the NCAP programme, plans are to cut industrial and vehicle emissions, reduce pollution from dust and other powder type materials and impose strict restrictions on the use of biofuels and biomass burning. There are also plans to increase the number of monitoring stations to provide more accurate data. The main drawback to this is that the NCAP has no legal status so local governments can only voluntarily comply.
The Maharashtra state government’s pollution mitigation plans seems inadequate to tackle the problem of air pollution. The plans originally prepared by the Maharashtra Pollution Control Board (MPCB) were initially rejected by the Central Pollution Control Board (CPCB) but revisions were made and are now accepted. However, they are being criticised for ignoring the major sources of pollution from industry and automobiles.
Individuals are being encouraged to make personal changes by choosing to carpool or use public transport instead of using their own private vehicle. Switching over to greener fuels would be environmentally beneficial too.
A coastal city such as Mumbai should not have such high levels of pollution due to its location. It is in this state because of the illegal burning of waste products, a poor planning system for its transportation and industrial units in residential areas. The future objective is to provide a sustainable city model with affordable public transport and low cost energy from renewable sources. The key factor in achieving this goal is to reduce the amount of petroleum products currently being used.
When is the air pollution in Mumbai at its worst?
The air pollution in Mumbai is typically at its worst from November to February which are the winter months. During this time, there is considerably less rainfall which acts as a cleanser for the air. During November the most polluted area within the city was the Bandra Kurla Complex with a US AQI figure of 305 which is classed as very poor. The PM2.5 reading came in at 85.9 µg/m³. PM10 recorded a concentration of 145.7 µg/m³, O3 measured 8.7 µg/m³ and NO2 recorded a concentration of 80.8 µg/m³. These are typical figures for the month of November which is statistically one of the worst months.
Is Mumbai the city with the worst air pollution?
The PM2.5 concentration in India in 2019 was 5 times above World Health Organisation exposure recommendation of 10 µg/m³.
In 2019, Mumbai ranked number 169 among the world’s most polluted cities included in IQAir’s 2019 World Air Quality Report, with an annual average PM2.5 figure of 45.3 µg/m³. Compare this to Delhi air quality which ranked number 2 with an average PM2.5 figure of 98.6 µg/m³. The top position went to the Indian city of Ghaziabad with a 2019 average of 110.2 µg/m³ noticeably different from the 2018 figures
In 2018, Mumbai ranked number 71 whilst the Indian city of Gurugram took pole position. Delhi, India’s capital was ranked number 11. Unfortunately these figures show the situation is getting worse, not better.
Due to its coastal location, Mumbai’s air pollution is eased by the prevailing sea breezes which help to disperse the particulate matter suspended in the air.
Where is the cleanest air quality in Mumbai?
- Saibaba Complex Rd36
- S.k.Furniture46
- Bandra Kurla Complex, Mumbai - MPCB58
- Bandra, Mumbai - MPCB58
- Borivali East, Mumbai - MPCB58
- Chembur, Mumbai - MPCB58
- Chhatrapati Shivaji Intl. Airport (T2), Mumbai - MPCB58
- Deonar, Mumbai - IITM58
- Kherwadi_Bandra East, Mumbai - MPCB58
- Kurla, Mumbai - MPCB58
- Mindspace-Malad West, Mumbai - MPCB58
- Powai, Mumbai - MPCB58
- Siddharth Nagar-Worli, Mumbai - IITM58
- Sion, Mumbai - MPCB58
- Vasai West, Mumbai - MPCB58
- Vile Parle West, Mumbai - MPCB58
- Colaba, Mumbai - MPCB59
- Ghatkopar, Mumbai - BMC59
- Kandivali East, Mumbai - MPCB59
- Kandivali West, Mumbai - BMC59
- Mulund West, Mumbai - MPCB59
- Sewri, Mumbai - BMC59
- Shivaji Nagar, Mumbai - BMC59
- Worli, Mumbai - MPCB59
- Byculla, Mumbai - BMC61
- Bandra - Hill Road68
- Borivali73
- IQAir Outdoor Monitor @ Juhu JVPD81
- kalaGodha92


