

Sofia air quality map
Live air pollution map of Sofia • 267.6K Followers • 06:00, Jun 04 Local time

Stations
Clean Air Facilities
Contributors
Government
1Diplomatic
0Non-profit
0Education
1Corporate
1Healthcare
0Hospitality
0Individual
17Top contributors in Sofia
Who is sharing outdoor air quality data in Sofia?
Featured station
Discover some of the best station installation in Sofia
Station gallery

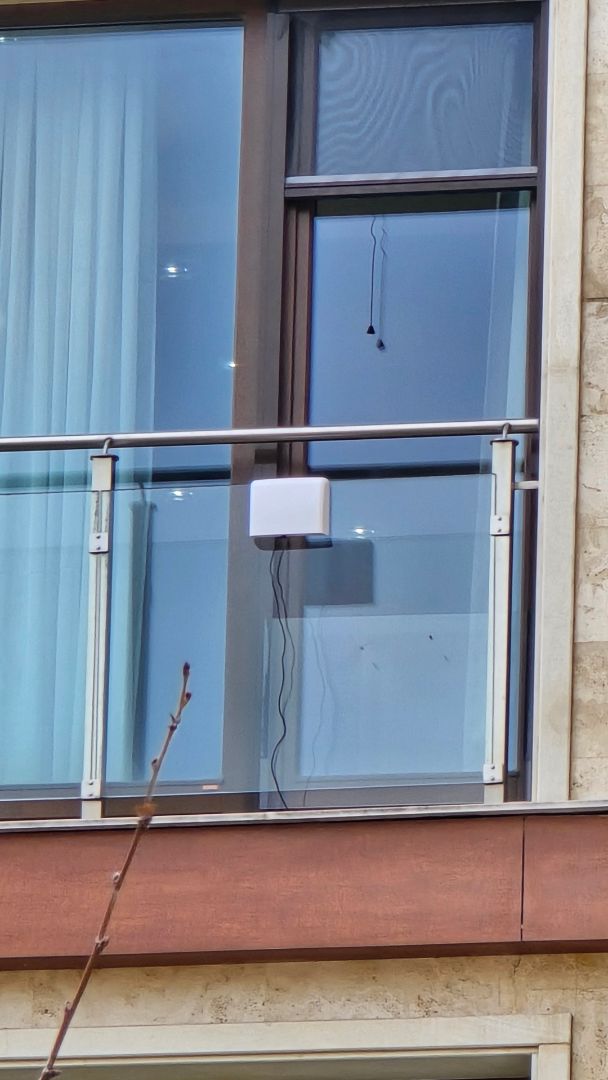
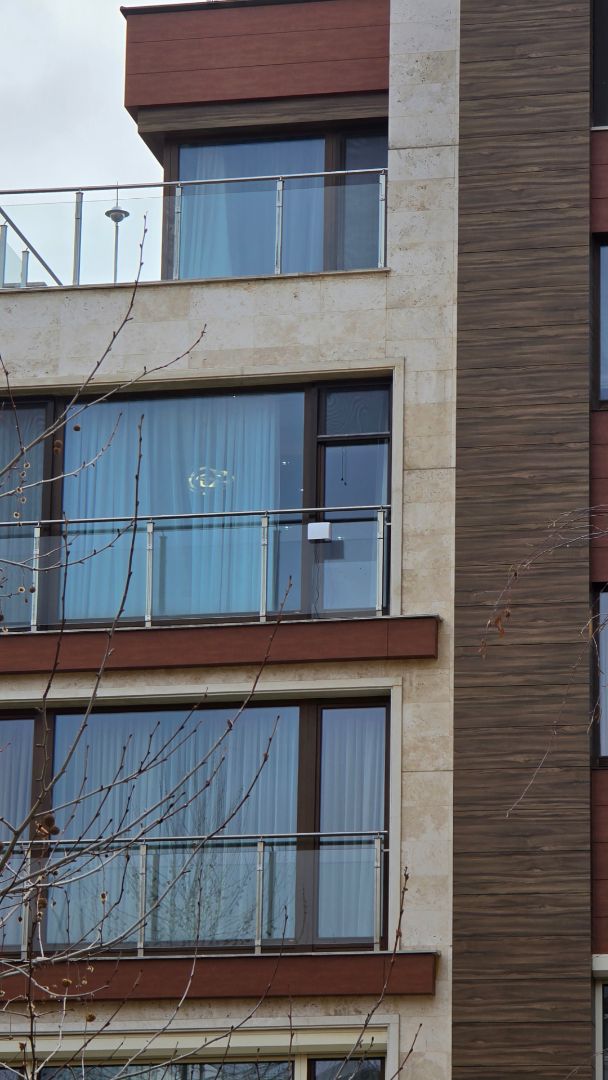
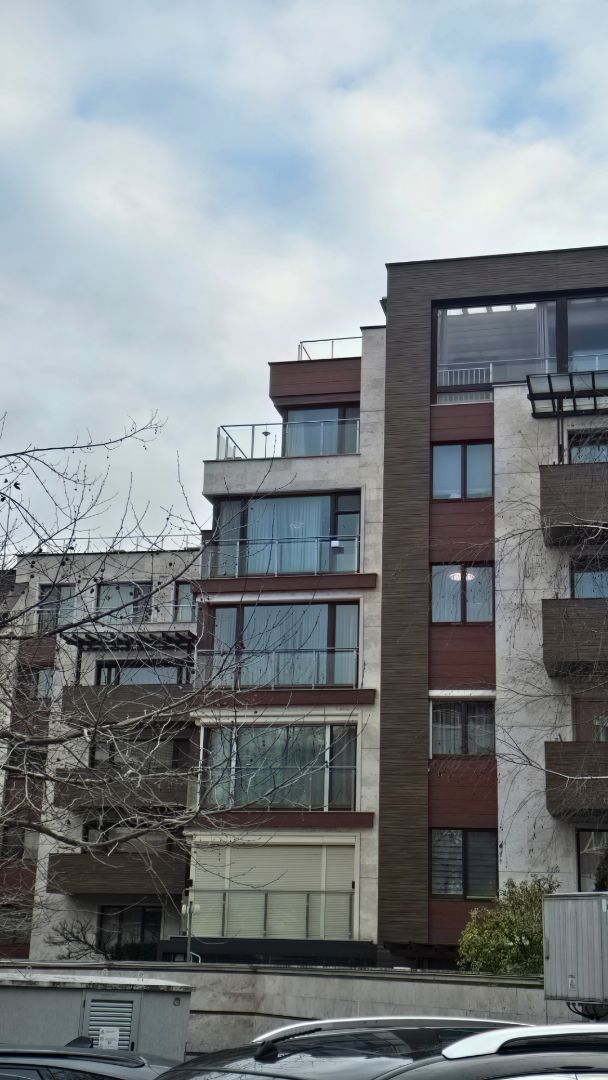
MONASTIRSKY LIVADI, Sofia
50
Newest stations deployed in Sofia
AQI⁺ station rankingNewest stations


Learn more about global air quality


Learn more about air pollution in Sofia
What is the air quality index of Sofia?
Sofia is the capital and the largest city in Bulgaria. It is situated in a valley in the western part of the country at the foot of the Vitosha Mountain. The estimated 2019 population was 1.6 million people.
In 2019, Sofia experienced “Moderate” quality air with an average figure of 26.8 µg/m³. This level was consistent throughout the year except for July and December when the quality became “Unhealthy for sensitive groups” with readings of 46.9 and 50.8 µg/m³, respectively. These are based on the recommended levels by the World Health Organisation (WHO). Over the last three years, these levels have been consistent with a 2017 figure of 20.8 µg/m³, a 2018 figure of 28.2 µg/m³ and a 2019 figure of 26.8 µg/m³.
What is the main source of Sofia’s polluted air?
The main air pollutants in Sofia are from heating by burning wood, coal and garbage, road traffic and industries in and around the outskirts of the city. Specific weather conditions contribute to the current high levels of pollution. Such is the lack of wind and the fact that Sofia is located in a valley, in which an inversion is relatively often formed, which does not allow the dirty air to "escape".
It has been reported that 25 per cent of the air pollution in Sofia with dangerous fine dust particles is due to the uncleaned streets, dust during construction activities and parking in green areas known as the so-called resuspension of soil and dust. Pollution by resuspension of soil is associated with the spread of dust, which exists on the streets, buildings and roofs of the city and is created by human activity, parking in gardens and more. Fine dust particles are also formed when tyres and brake pads are subject to abrasion by friction.
In 2019, however, one monitoring station in the country registered concentrations above the daily and hourly permissible limit of sulphur dioxide. Although not explicitly mentioned in the report, the station is probably the one in Galabovo near Stara Zagora, which has an unfortunate history of having very bad air quality. At the end of July, Brussels announced that the EC was filing a lawsuit for exceeding the sulphur dioxide levels in the area of Galabovo, where the largest coal-fired power stations are concentrated. The first step is to determine if there is a violation, and then a fine will probably follow.
Coal plants are responsible for almost all of the country's sulphur dioxide, as well as most of the nitrogen oxide emissions that cause smog and acid rain.
Is air pollution in Sofia getting better or worse?
Air pollution still causes about 400,000 deaths a year across Europe. And although the overall air picture is improving in Bulgaria, the country remains among those with the biggest problems with fine particulate matter PM2.5 and PM10 and even sulphur dioxide (SO2).
Bulgaria is among the six-member states in which the permissible limit of the smallest particles PM2.5, was crossed in 2018. The other countries are Croatia, the Czech Republic, Italy, Poland and Romania. However, given the stricter maximum concentration limit used by the World Health Organisation (WHO), only four countries in Europe which are Estonia, Finland, Iceland and Ireland remain below it.
The chronic depopulation of the province and the resulting relocation of people and redevelopment in the capital aggravates the problem. More people living in the city require transport to move from one place to another. Usually, that involves the burning of fossil fuel of some sort.
What can be done to improve the air quality in Sofia?
On 25th November, local authorities in Sofia announced that it was introducing two measures to prevent pollution, which were free buffer parking lots on the subway and inspections by the inspectorate and police on construction sites and transport arteries for unregulated burning. In the Krasna Polyana and Slatina districts, a campaign is underway for free installation of filters on the chimneys of homes that are heated by wood-burning and coal. The other initiative of the municipality for replacement of the old stoves has not been implemented yet.
A program has been developed for the improvement of green spaces, which have so far been used as parking spaces. The first three regions that will receive funding for parking, grassing, planting trees and fencing are Ovcha Kupel, Krasna Polyana and Nadezhda. Inspections are also carried out on construction sites, including trucks transporting construction materials and waste to ensure that they abide by the rules and regulations regarding the transportation of powders and dust-like substances.
At the end of 2019, Sofia Municipality put into operation 22 new stations with sensors for measuring air pollution. Their readings can be monitored in real-time on an app. The stations are installed in a wide perimeter of Sofia's neighbourhoods, but there is only one in the centre which is next to the GS Rakovski Military Academy. These stations are a set of measuring sensors which detect key pollutants such as PM10, PM2.5, nitrogen dioxide, sulphur dioxide, ozone and carbon monoxide, as well as meteorological parameters such as temperature, humidity and pressure. Sensor stations allow future upgrades with additional sensors (e.g. for noise pollution).
Measurements from stations in real-time are transmitted to a cloud platform for storage, visualisation and subsequent analysis. Everyone can check the current readings of the stations and the condition of the various pollutants, as well as the history of readings from the last 14 days. Armed with such information, better decisions can be made as to where is considered to be safe at the moment.
What are the effects of breathing Sofia’s poor quality air?
Dirty air is harmful to human health, according to numerous international studies.
In Bulgaria, more than 8,500 people die prematurely each year from diseases caused by air pollution. This is more than those who die in car accidents according to official data of the World Health Organisation.
The country has the third-highest mortality rate caused by air pollution in the world (after North Korea and Bosnia and Herzegovina). According to the WHO, low air quality costs 29.5 per cent of the country's GDP due to reduced productivity and health care costs.
Where is the cleanest air quality in Sofia?
- Mladost 118
- Bistritsa20
- Anglo-American School: Vitosha22
- Residential Park Sofia22
- Sofia, Mladost-422
- 11-ti August28
- Borovo - Rodopski izvor28
- Boyana (Dobri Bojilov)28
- LYULIN PLAZA28
- Sofia - Dragalevtsi28
- aircare.bg 128
- aircare.bg 228
- Obelya 2 - 242A31
- Sofia, Mladost - AirGradient32
- Sofia, Zona-B1932
- Gentle Park33
- Levski-G33
- Соф�ия Добруджа 533
- Sofia, 13 Dimitar Petkov Str.47
- Anglo-American School: Balkan50
- MONASTIRSKY LIVADI50
- Sofia - Kopitoto60
- Sofia - Nadezhda64
- Sofia - Druzhba69
- Sofia - IAOS/Pavlovo73
- Sofia - Hipodruma75


