Air quality in Xingtai
Air quality index (AQI) and PM2.5 air pollution in Xingtai
1.8K people follow this city

Xingtai Air Quality Map
Real-time Xingtai air pollution map
Weather
What is the current weather in Xingtai?
| Weather | Clear sky |
| Temperature | 82.4°F |
| Humidity | 31% |
| Wind | 10.8 mp/h |
| Pressure | 29.6 Hg |
live aqi city ranking
Real-time China city ranking
| # | city | US AQI |
|---|---|---|
| 1 | Zhangye, Gansu | 650 |
| 2 | Leshan, Sichuan | 172 |
| 3 | Beijing, Beijing | 166 |
| 4 | Jinchang, Gansu | 162 |
| 5 | Tangjiazhuang, Hebei | 162 |
| 6 | Tongzhou, Beijing | 160 |
| 7 | Nagqu, Tibet | 159 |
| 8 | Jingmen, Hubei | 158 |
| 9 | Wuhan, Hubei | 158 |
| 10 | Changli, Hebei | 157 |
(local time)
SEE WORLD AQI RANKING3D animated air pollution map

live Xingtai aqi ranking
Real-time Xingtai air quality ranking
| # | station | US AQI |
|---|---|---|
| 1 | Xing Shi College | 161 |
| 2 | Xing Shi High School | 161 |
| 3 | Xindou City Environmental Protection Bureau | 153 |
| 4 | Xingshigao Zhuan | 153 |
| 5 | Nanhe No.1 Middle School | 151 |
| 6 | Ningjin Experimental No.1 Elementary School | 137 |
| 7 | Luqiao Construction Company | 134 |
| 8 | Pingxiang Local Taxation Bureau | 134 |
| 9 | Renze Youth Cultural Activity Center | 134 |
| 10 | Da Huoan Xie Jie | 132 |
(local time)
SEE WORLD AQI RANKINGUS AQI
117
live AQI index
Unhealthy for sensitive groups
Overview
What is the current air quality in Xingtai?
| Air pollution level | Air quality index | Main pollutant |
|---|---|---|
| Unhealthy for sensitive groups | 117 US AQI | PM2.5 |
| Pollutants | Concentration | |
|---|---|---|
| PM2.5 | 42µg/m³ | |
| PM10 | 112µg/m³ | |
| O3 | 58µg/m³ | |
| NO2 | 24µg/m³ | |
| SO2 | 10µg/m³ | |
| CO | 500µg/m³ | |
PM2.5
x8.4
PM2.5 concentration in Xingtai is currently 8.4 times the WHO annual air quality guideline value
Health Recommendations
What is the current air quality in Xingtai?
| Reduce outdoor exercise | |
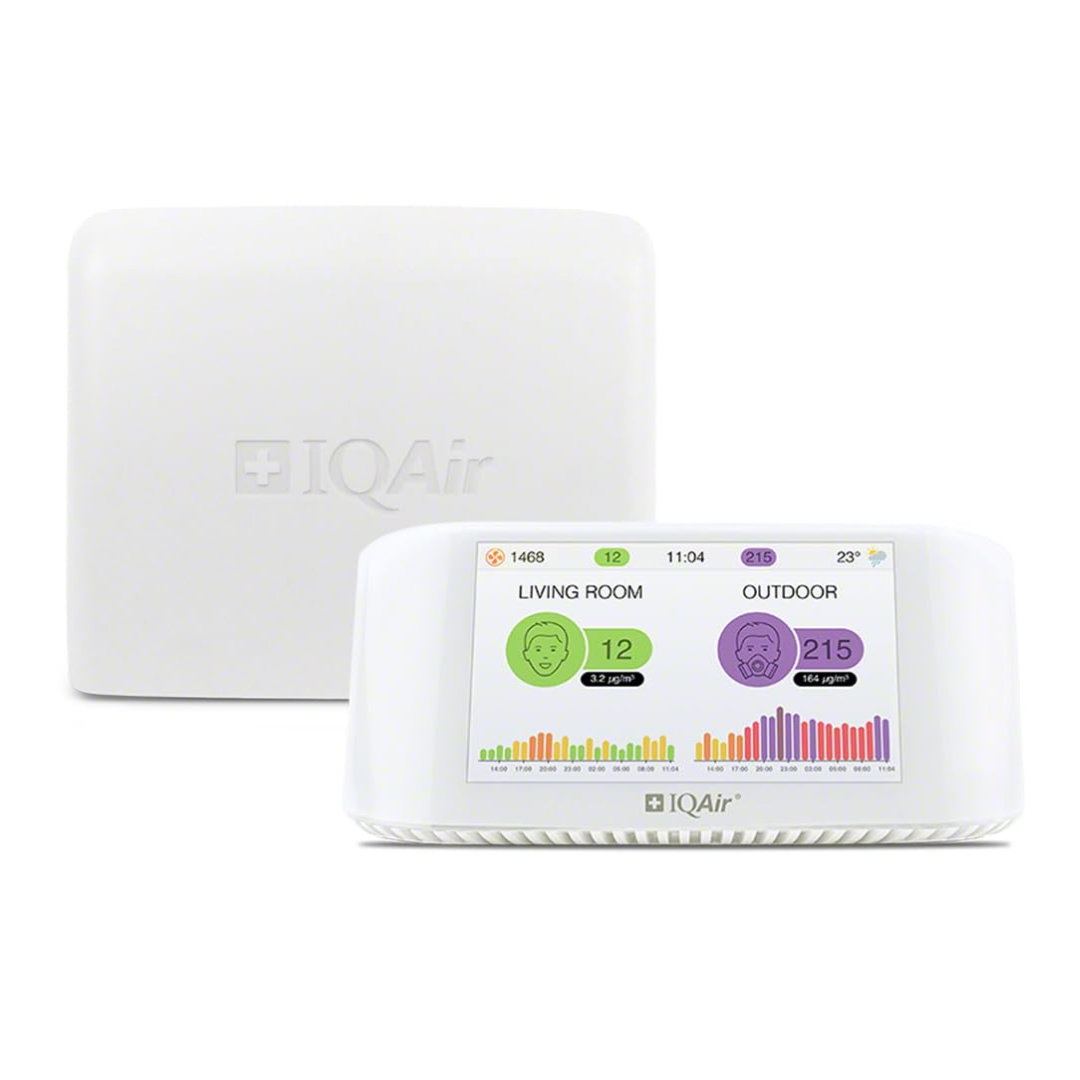
| Close your windows to avoid dirty outdoor air GET A MONITOR | |
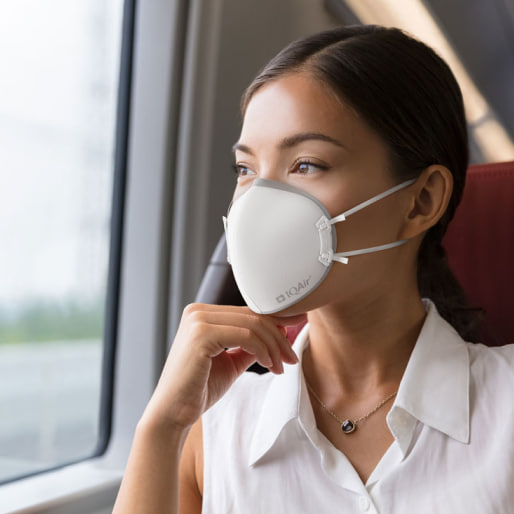
| Sensitive groups should wear a mask outdoors GET A MASK | |
| Run an air purifier GET AN AIR PURIFIER |
Forecast
Xingtai air quality index (AQI) forecast
| Day | Pollution level | Weather | Temperature | Wind |
|---|---|---|---|---|
| Tuesday, Apr 23 | Moderate 59 AQI US | 75.2° 57.2° | ||
| Wednesday, Apr 24 | Moderate 89 AQI US | 86° 53.6° | ||
| Thursday, Apr 25 | Unhealthy for sensitive groups 108 AQI US | 93.2° 62.6° | ||
| Today | Unhealthy for sensitive groups 117 AQI US | 95° 64.4° | ||
| Saturday, Apr 27 | Unhealthy for sensitive groups 137 AQI US | 87.8° 64.4° | ||
| Sunday, Apr 28 | Unhealthy for sensitive groups 137 AQI US | 78.8° 59° | ||
| Monday, Apr 29 | Unhealthy for sensitive groups 111 AQI US | 73.4° 55.4° | ||
| Tuesday, Apr 30 | Moderate 72 AQI US | 73.4° 57.2° | ||
| Wednesday, May 1 | Moderate 65 AQI US | 82.4° 53.6° | ||
| Thursday, May 2 | Moderate 67 AQI US | 82.4° 62.6° |
Interested in hourly forecast? Get the app
How to best protect from air pollution?
AIR QUALITY ANALYSIS AND STATISTICS FOR Xingtai
Is Xingtai a city with bad air pollution?
Xingtai is a city located in the southern region of Hebei province, which itself is part of northern China. Looking at the quality of the air recorded in late April of 2021, it can be seen that Xingtai is subject to some less than perfect levels of air quality, with readings from both 2021 and 2020 giving indications that there are numerous pollutive issues. These issues can cause damage to both human health as well as the environment, and as such need to be reduced in the coming years if citizens on Xingtai are to suffer from less ill effects brought on by exposure to high levels of pollution.
The readings of US AQI (a standard of measurement used to indicate how clean or polluted the air is) taken in late April were ones such as 107, a fairly high reading that placed Xingtai into the ‘unhealthy for sensitive groups bracket’ on that particular day. When looking at the surrounding days on record that were taken in both March and April, it can be seen that Xingtai remained consistently polluted, with average US AQI readings coming in between 105 up to 199, all of which would classify the air as being ‘unhealthy’. However, there was one day in late March that came in with a sizeable reading of 681, a number that would categorize that day as being hazardous.
This means that the air would be permeated by thick clouds of smoke, haze, toxic chemical compounds as well as all manner of fine particulate matter, which can cause numerous adverse health effects when inhaled. As such, Xingtai is a city that maintains a poor level of air quality as its average, and is also subject to extremes of air pollution, typically brought about by industrial activity, as well as anthropogenic movement and certain meteorological conditions (lack of wind or rain, colder temperatures) that can cause these massive spikes in the pollution readings.
Looking at the data gathered over the course of 2020 as a concise long term measurement, it can also be seen that Xingtai had many months of the year that came in with very poor averages. In terms of its yearly average, Xingtai presented with a PM2.5 reading of 55.9 μg/m³, a number that placed it within the ‘unhealthy’ ratings bracket, which requires a PM2.5 reading of anywhere between 55.5 to 150.4 μg/m³ to be classified as such.
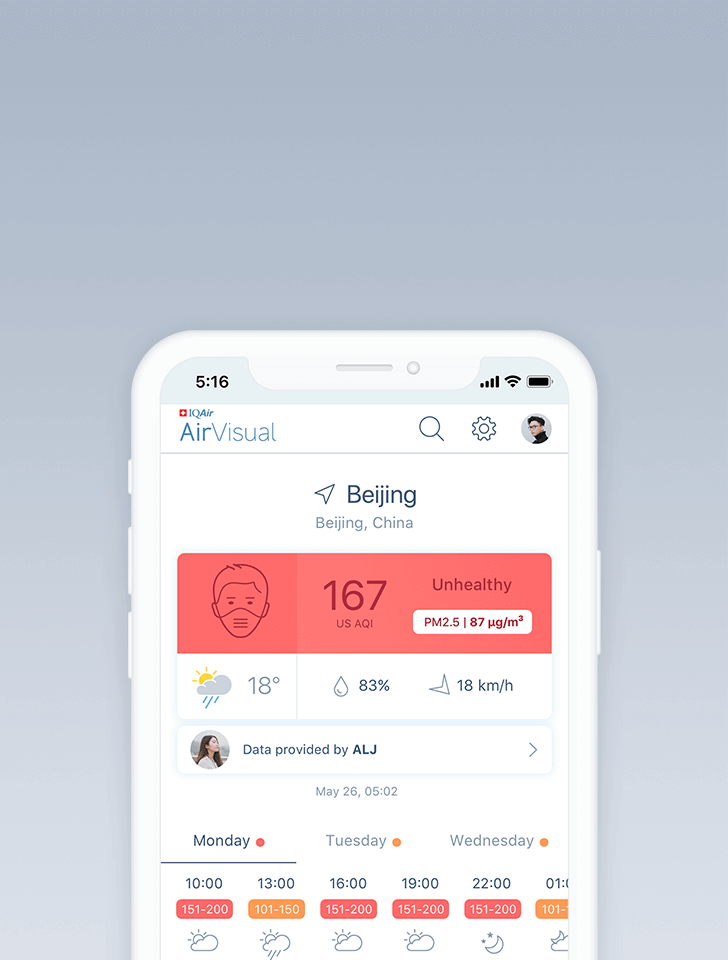
This reading of 55.9 μg/m³, aside from just placing it within the ‘unhealthy’ ratings bracket (being only 0.4 units away from moving down to the next pollution ratings group), also placed it in 12th place out of all cities ranked in China, as well as 59th place out of all cities ranked worldwide. This is a less than appreciable placing, showing that Xingtai was in the upper echelons of most polluted cities in the world, and continues to show high levels of pollution in the following year. As such, the wearing of high quality particle filtering masks as well as avoiding outdoor activity during days of high pollution levels (as was covered earlier regarding the day with its US AQI reading of 681) is highly recommended. These pollution levels can be monitored via the use of air quality maps such as the one available on this page, or via the AirVisual app.
What causes Xingtai to have polluted air quality?
Xingtai has numerous sources of pollution that come together to cause the compounded levels of both US AQI and PM2.5 seen on record. PM2.5 is one of the main components used in calculating the overall air quality index, as well as being a prominent measure in its own right. It refers to particulate matter that is 2.5 micrometers or less in diameter, making it roughly 30% the size of a human hair, often going down to sizes many times smaller. Due to these extremely small sizes, and the variety of materials it is comprised of, it presents significant danger to human health when respired.
Some of the main causes of PM2.5 and other contaminants in the air would be vehicle emissions and fumes. Cars and larger freight vehicles such as lorries and trucks put out large amounts of chemicals such as nitrogen dioxide (NO2) and sulfur dioxide (SO2), as well as lower quality or aged vehicles leaking oil vapors and giving out greater amounts of harmful particulate matter such as black coal (typically formed from the incomplete combustion of both fossil fuels, as well as organic material, along with volatile organic compounds).
One of the more prominent causes is that of industrial emissions, with Xingtai being a heavily industrialized city and thus subject to huge amounts of smoke and haze as a result of the combustion processes taking place within these factories and industrial facilities, as well as a lack of stringent emission standards also contributing to the huge levels of pollution emitted, although this is changing in more recent times.
However, it still stands to reason that industrial effluence, both from the fuels being burnt (typically coal or natural gas, as well as diesel), along with any industrial waste produced as a byproduct (such as plastic fumes, heavy metals and other highly dangerous materials) are the main causes of pollution in Xingtai.
When is the pollution level highest in Xingtai?
Observing the data collected over the course of 2020, Xingtai exhibited its highest level of air pollution in the months of January and February, as well as November and December, all of which came in with ‘unhealthy’ air quality ratings. Their respective readings of PM2.5 were 143 μg/m³, 66.6 μg/m³, 65.1 μg/m³ and 80.4 μg/m³, making January the most polluted month of a year by a significant amount with its reading of 143 μg/m³, close to moving up to the ‘very unhealthy’ ratings bracket.
Does Xingtai have cleaner levels of air quality?
In contrast to the more severely polluted months of the year, there were also shorter periods of better air quality, relatively speaking. The months of May, August and September all came in with the cleanest qualities of air, sitting within the ‘moderate’ pollution ratings bracket. Their respective readings were 35.2 μg/m³, 29.3 μg/m³ and 33.1 μg/m³, making August the cleanest month of the year with its reading of 29.3 μg/m³. Of note is that many cities in China, particularly in the northern region, saw their cleanest levels of air quality in this month.
Who is most vulnerable to air pollution in Xingtai?
Certain groups and portions of the population who should take extra care during episodes of higher pollution are ones such as young children and babies, the elderly, pregnant mothers, as well as those with pre-existing health conditions, compromised immune systems, along with those that have a general poor level of health. These groups are considered as the most at risk, and employing the aforementioned preventative measures during pollution spikes would be of the utmost importance.
Xingtai air quality data attribution
Where is the cleanest air quality in Xingtai?
- Nangong First Primary School 93
- Nangong Pure Water Bank Community 93
- Long Yao Cultural Development Center 95
- Ningjin County Government 99
- Shahe Propaganda and Cultural Center 99
- Julu Administrative Service Center 105
- Longyao Market Supervision Bureau 105
- Xindu Huangsi Town Government 106
- Neiqiu Fuhai Community 107
- Weixian County Shuangchuang Park 107
- Renze Jinan Revolutionary Memorial Hall 112
- Baixiang Power Supply Company 117
- Lincheng Suburban Power Supply Station 119
- Boxiang Hanbo Hotel 129
- Lincheng Transportation Bureau 129
- Neiqiu Cultural Activity Center 129
- Da Huoan Xie Jie 132
- Ningjin Housing and Construction Bureau 132
- Luqiao Construction Company 134
- Pingxiang Local Taxation Bureau 134
- Renze Youth Cultural Activity Center 134
- Ningjin Experimental No.1 Elementary School 137
- Nanhe No.1 Middle School 151
- Xindou City Environmental Protection Bureau 153
- Xingshigao Zhuan 153
- Xing Shi College 161
- Xing Shi High School 161

