Air quality in Zhengzhou
Air quality index (AQI) and PM2.5 air pollution in Zhengzhou
690.3K people follow this city

Zhengzhou Air Quality Map
Real-time Zhengzhou air pollution map
Weather
What is the current weather in Zhengzhou?
| Weather | Clear sky |
| Temperature | 77°F |
| Humidity | 36% |
| Wind | 4.6 mp/h |
| Pressure | 29.9 Hg |
live aqi city ranking
Real-time China city ranking
| # | city | US AQI |
|---|---|---|
| 1 | Yangcun, Tianjin | 174 |
| 2 | Baoding Shi, Hebei | 164 |
| 3 | Dingzhou, Hebei | 164 |
| 4 | Dongying, Shandong | 163 |
| 5 | Jinchang, Gansu | 161 |
| 6 | Tianjin, Tianjin | 161 |
| 7 | Yangliuqing, Tianjin | 160 |
| 8 | Daxing, Beijing | 159 |
| 9 | Yigou, Henan | 159 |
| 10 | Changzhi, Shanxi | 158 |
(local time)
SEE WORLD AQI RANKING3D animated air pollution map

live Zhengzhou aqi ranking
Real-time Zhengzhou air quality ranking
| # | station | US AQI |
|---|---|---|
| 1 | Shangjie District Government | 134 |
| 2 | Sishiqi zhong | 119 |
| 3 | Yan chang | 114 |
| 4 | Huiji District Government | 112 |
| 5 | Yinhang xuexiao | 112 |
| 6 | Economic Development Zone Management Committee | 107 |
| 7 | Zheng Textile Machinery | 105 |
| 8 | Gongshui gongsi | 99 |
| 9 | City monitoring station | 95 |
| 10 | River Medical University | 84 |
(local time)
SEE WORLD AQI RANKINGUS AQI
110
live AQI index
Unhealthy for sensitive groups
Overview
What is the current air quality in Zhengzhou?
| Air pollution level | Air quality index | Main pollutant |
|---|---|---|
| Unhealthy for sensitive groups | 110 US AQI | PM2.5 |
| Pollutants | Concentration | |
|---|---|---|
| PM2.5 | 39µg/m³ | |
| PM10 | 118.5µg/m³ | |
| O3 | 76.5µg/m³ | |
| NO2 | 35µg/m³ | |
| SO2 | 10µg/m³ | |
| CO | 700µg/m³ | |
PM2.5
x7.8
PM2.5 concentration in Zhengzhou is currently 7.8 times the WHO annual air quality guideline value
Health Recommendations
What is the current air quality in Zhengzhou?
| Reduce outdoor exercise | |
| Close your windows to avoid dirty outdoor air GET A MONITOR | |
| Sensitive groups should wear a mask outdoors GET A MASK | |
| Run an air purifier GET AN AIR PURIFIER |
Forecast
Zhengzhou air quality index (AQI) forecast
| Day | Pollution level | Weather | Temperature | Wind |
|---|---|---|---|---|
| Monday, Apr 15 | Unhealthy for sensitive groups 118 AQI US | 82.4° 59° | ||
| Tuesday, Apr 16 | Moderate 90 AQI US | 77° 57.2° | ||
| Wednesday, Apr 17 | Unhealthy for sensitive groups 102 AQI US | 80.6° 60.8° | ||
| Today | Unhealthy for sensitive groups 110 AQI US | 82.4° 60.8° | ||
| Friday, Apr 19 | Unhealthy for sensitive groups 119 AQI US | 64.4° 57.2° | ||
| Saturday, Apr 20 | Unhealthy for sensitive groups 117 AQI US | 73.4° 55.4° | ||
| Sunday, Apr 21 | Unhealthy for sensitive groups 125 AQI US | 78.8° 59° | ||
| Monday, Apr 22 | Unhealthy for sensitive groups 113 AQI US | 78.8° 60.8° | ||
| Tuesday, Apr 23 | Moderate 73 AQI US | 77° 60.8° | ||
| Wednesday, Apr 24 | Moderate 63 AQI US | 80.6° 55.4° |
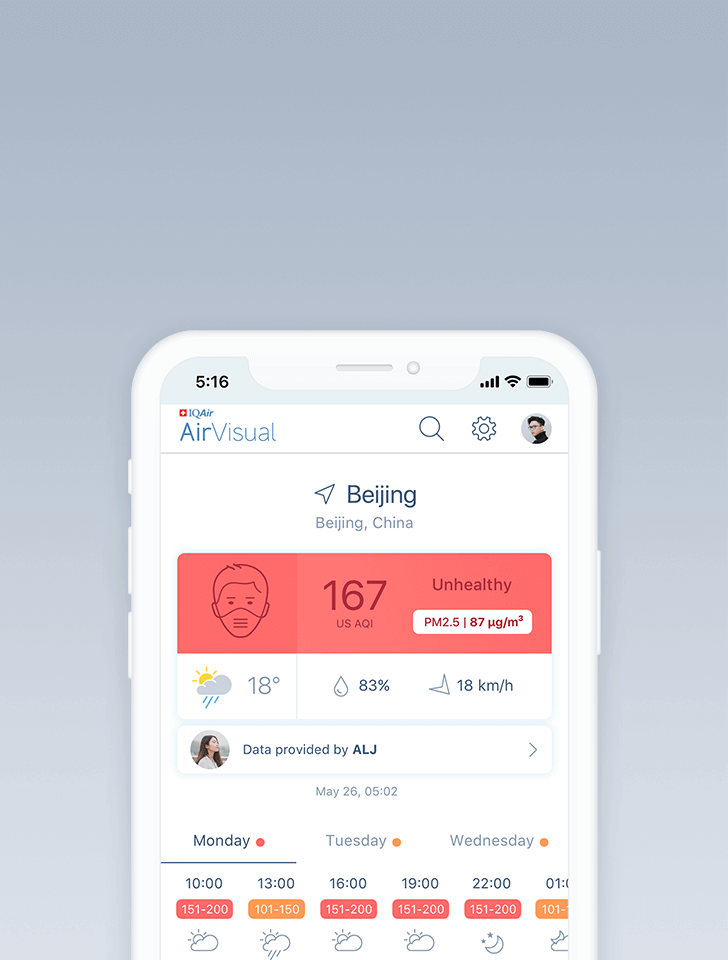
Interested in hourly forecast? Get the app
AIR QUALITY ANALYSIS AND STATISTICS FOR Zhengzhou
Does Zhengzhou have a high level of air pollution?
Zhengzhou is a city located in the central region of China, within Henan province. It is both the capital and largest city of said province, being home to over ten million inhabitants. It is well connected to other cities and provinces in China with a highly developed travel and trade infrastructure. As a result of these traits, combined with an ever growing population, higher demand for housing and property, as well as increases in industry, Zhengzhou suffers from much poorer air quality as a result.
This has been a reoccurring theme within the city, and has actually improved upon its air pollution levels over the last few years by a significant amount (the readings of which will be cited later in the article). However, it still stands to reason that despite large improvements, the air quality is still fairly hazardous, and can do much more to improve.
In late April of 2021, Zhengzhou was seen with a US AQI reading of 85, a somewhat decent reading that placed it into the ‘moderate’ pollution ratings bracket. This would indicate that at the time this reading was taken, the air would be relatively safe to breathe but may still present some health risks to vulnerable portions of the population. These include young children and babies, expecting mothers, the elderly and infirm, as well as those with compromised immune systems or pre-existing health conditions, as well as those with a hypersensitivity towards certain chemical pollutants.
Readings of US AQI taken in days prior to the number shown above display the Zhengzhou was not always sitting steadfast in the moderate pollution zone, but instead had days in which the pollution level rose to severely high levels. Between late March through to April of 2021, higher readings of US AQI were taken, with figures coming at 129 (unhealthy for sensitive groups rating), 170 (unhealthy air quality rating), 206 (very unhealthy) and lastly a highly elevated reading of 375.
This reading of 375 would place Zhengzhou into the ‘hazardous’ air quality ratings bracket for that particular day that it was taken (mid-April), and would indicate that the air would be absolutely permeated by a multitude of contaminants, with smoke, haze, smoke and all manner of dangerous particulate matter filling the atmosphere, causing widespread damage to the health of Zhengzhou’s citizens, as well as even to various ecosystems, wildlife and vegetation.
The use of preventative measures or safeguarding one’s health would be highly important during these time periods, with actions such as the wearing of fine particle filtering masks, as well as avoiding outdoor activity or exercise also being highly effecting in helping to reduce an individual’s level of exposure.
What are the pollution sources present in Zhengzhou?
As mentioned above, the numerous sources of air pollution present in Zhengzhou can cause a myriad of health risks to the furthest reaches of the population, from those with pre-existing poor health all the way to healthy young adults. These periods of higher air pollution levels can be tracked via air quality maps, such as the one present on the top of this page, or via the AirVisual app.
Main sources of air pollution include factories, power plants and all manner of related industrial zones. These sites utilize large amounts of coal, as well as other fossil fuels such as natural gas or diesel. When combusted, many dangerous chemical compounds and hazardous forms of both coarse (PM10) and fine (PM2.5) particulate matter are released into the air.
Construction sites also present another major source of air contamination, giving off large amounts of particulate matter of their own, far more than many people are aware of. Large amounts of finely ground gravel or silica dust, as well as even heavy metals such as lead or mercury can leak from these sites, causing adverse health effects to those nearby as well as accumulating within the environment or combining with other pollutants to produce deadlier forms of pollution, often known as secondary pollutants (those that form in the atmosphere as a result of chemical reactions or the bonding of materials). Primary pollutants come directly from a polluting source such as a car engine or factory boiler.
When are pollution levels at their highest within Zhengzhou?
Zhengzhou saw many months of high pollution episodes over the course of 2020, using this time period as a concise measure of what an entire year looks like. As its yearly average PM2.5 reading taken over 2020, Zhengzhou came in with a reading of 50.9 μg/m³. This placed the city in the ‘unhealthy for sensitive groups’ bracket, which requires a PM2.5 reading of anywhere between 35.5 to 55.4 μg/m³ to be classified as such. This reading made Zhengzhou come in on the higher end of this ratings bracket, being only several units away from moving up to the ‘unhealthy’ rating, which is 55.5 μg/m³ and beyond.
As mentioned before, whilst this level of air pollution is still quite bad, placing Zhengzhou in the list of top 100 most polluted cities worldwide in 2020, it has shown marked improvements. In 2019 it presented with a reading of 58.4 μg/m³, 2018 with 64.1 μg/m³ and 2017 with 70 μg/m³. These are great improvements that show the city has come a long way in regards to its air quality, however with present readings from 2020, it still came in at 37th place out of all cities ranked in China, as well as 95th place out of all cities ranked worldwide.
The most polluted months in 2020 were January, February, November and December, with January coming in with the highest reading at 119.8 μg/m³.
Does Zhengzhou have months in which the air quality is cleaner?
After the higher levels of air pollution dropped, Zhengzhou entered into a period of time in which the air quality was significantly better, albeit still slightly raised. The months of may through to September came all came in with ‘moderate’ readings of pollution, making it the cleanest time period of the year.
Does breathing polluted in Zhengzhou come with any health risks?
Health risks associated with breathing elevated levels of pollution in Zhengzhou include problems such as chest pains, dry coughs, higher rates of both respiratory related infections as well as cancer, particularly of the lungs and skin, although possible in any part of the body due to the insidiously small size of PM2.5 and its ability to enter into the blood stream.
Other main respiratory conditions include ones such as pneumonia, bronchitis, aggravated forms of asthma as well as emphysema. Heart attacks, strokes and ischemic heart disease are all problems that show an increase along with rising pollution levels.


