

Dong Hoi air quality map
Live air pollution map of Dong Hoi
15.2K people follow this city

Full screen


Contributors category
0
Government
0
Educational
0
Non-profit organization
0
Corporate
0
Individual
0
Anonymous
Station(s) operated by
*IQAir’s AQI data modeled using satellite data. Learn more
Health Recommendations
 | Enjoy outdoor activities |
 | Open your windows to bring clean, fresh air indoors GET A MONITOR |
Dong Hoi does not have air sensor data
Be the first to measure and contribute air quality data to your community.
News
The latest air quality news and resources.


Understand air pollution and protect yourself
Dong Hoi MAP AIR QUALITY ANALYSIS AND STATISTICS
Is there a lot of good information about air quality on the air pollution map for Dong Hoi?
There is a lot of very interesting information about air quality and it is very easy to find from the main city page. Selecting the “map icon” from the top of the page will open up another page which is dedicated to providing all relevant current information about the state of the air.
When the page reopens, the viewer will notice the overall colouration of the map. This is a visual indication of the current state of the air. The colours are standard across the IQAir website and vary between pale green and dark maroon, where the darker colours indicate worsening quality.
The level of air quality is quoted by using the United States Air Quality Index reading or US AQI for short. This is calculated by taking measurements of up to six of the most prolific pollutants in city air. They are usually both sizes of Particulate Matter (PM2.5 and PM10), ozone, nitrogen dioxide, sulphur dioxide and carbon monoxide.
When studying the map, there will be several coloured discs scattered across it which represent the locations of the ground-level air monitoring stations, although they are not all under the direct control of the city. These stations collect and collate the information about air quality and display the US AQI reading at their centre. They also take on the appropriate colour to instantly indicate the air quality. Not all cities have physical monitoring stations and instead rely on information gathered by overhead satellites. Dong Hoi is a city without any physical stations but the end results are very much the same. The closest station in Vietnam to Dong Hoi is in Da Nang towards the south of the city.
Looking back to the main city page, it can be seen in the coloured banner across the top of it that at the end of March 2023, Dong Hoi was experiencing a period of “Moderate” air quality with a US AQI reading of 68. The asterisk to the right of the number signifies that the data is derived from satellite modelling. The main pollutant was found to be PM2.5 with a recorded level of 20.1 µg/m³ (microns per cubic metre) which is four times higher than the suggested target figure of 5 µg/m³ as recommended by the WHO.
Is there any more information about air quality to be found on the air pollution map for Dong Hoi?
There are a lot of fascinating facts and figures about air pollution on the air quality map for Dong Hoi. The page needs to be viewed in full-screen mode in order to see all the information it contains. The icon at the top of the page can be selected which will re-open the page at maximum size.
Once the page has re-opened in full-screen made, a list of four choices will appear down the left-hand side of the screen. These can each be turned on and off individually to see the effects they each have on the map.
The first option shows the sites of the ground-level air monitoring stations, but, as already stated, Dong Hoi has no actual stations and relies on satellites for its information. The second option shows the position of any wildfires there are that are burning out of control in the area. There are several icons on the map which represent these fires, but they are in neighbouring Laos so they do not pose a real threat. Option four shows the direction and speed of the wind which currently is blowing in the opposite direction of the fires so will carry the smoke away from the city.
Option number three can be very theatrical because it changes the colour of the map to show the current air quality. When the air quality is very poor, the colour will be quite dark and possibly, a little distracting. In this case, it can be deactivated and the colour will revert to paler shades more suitable for a map.
There is more information on the right-hand side of the screen in the form of a table. This shows the top seven most polluted cities across the globe. By selecting the full-ranking option, the remaining participating world cities will be seen in descending order.
Can the source of the polluted air be seen on the air quality map for Dong Hoi?
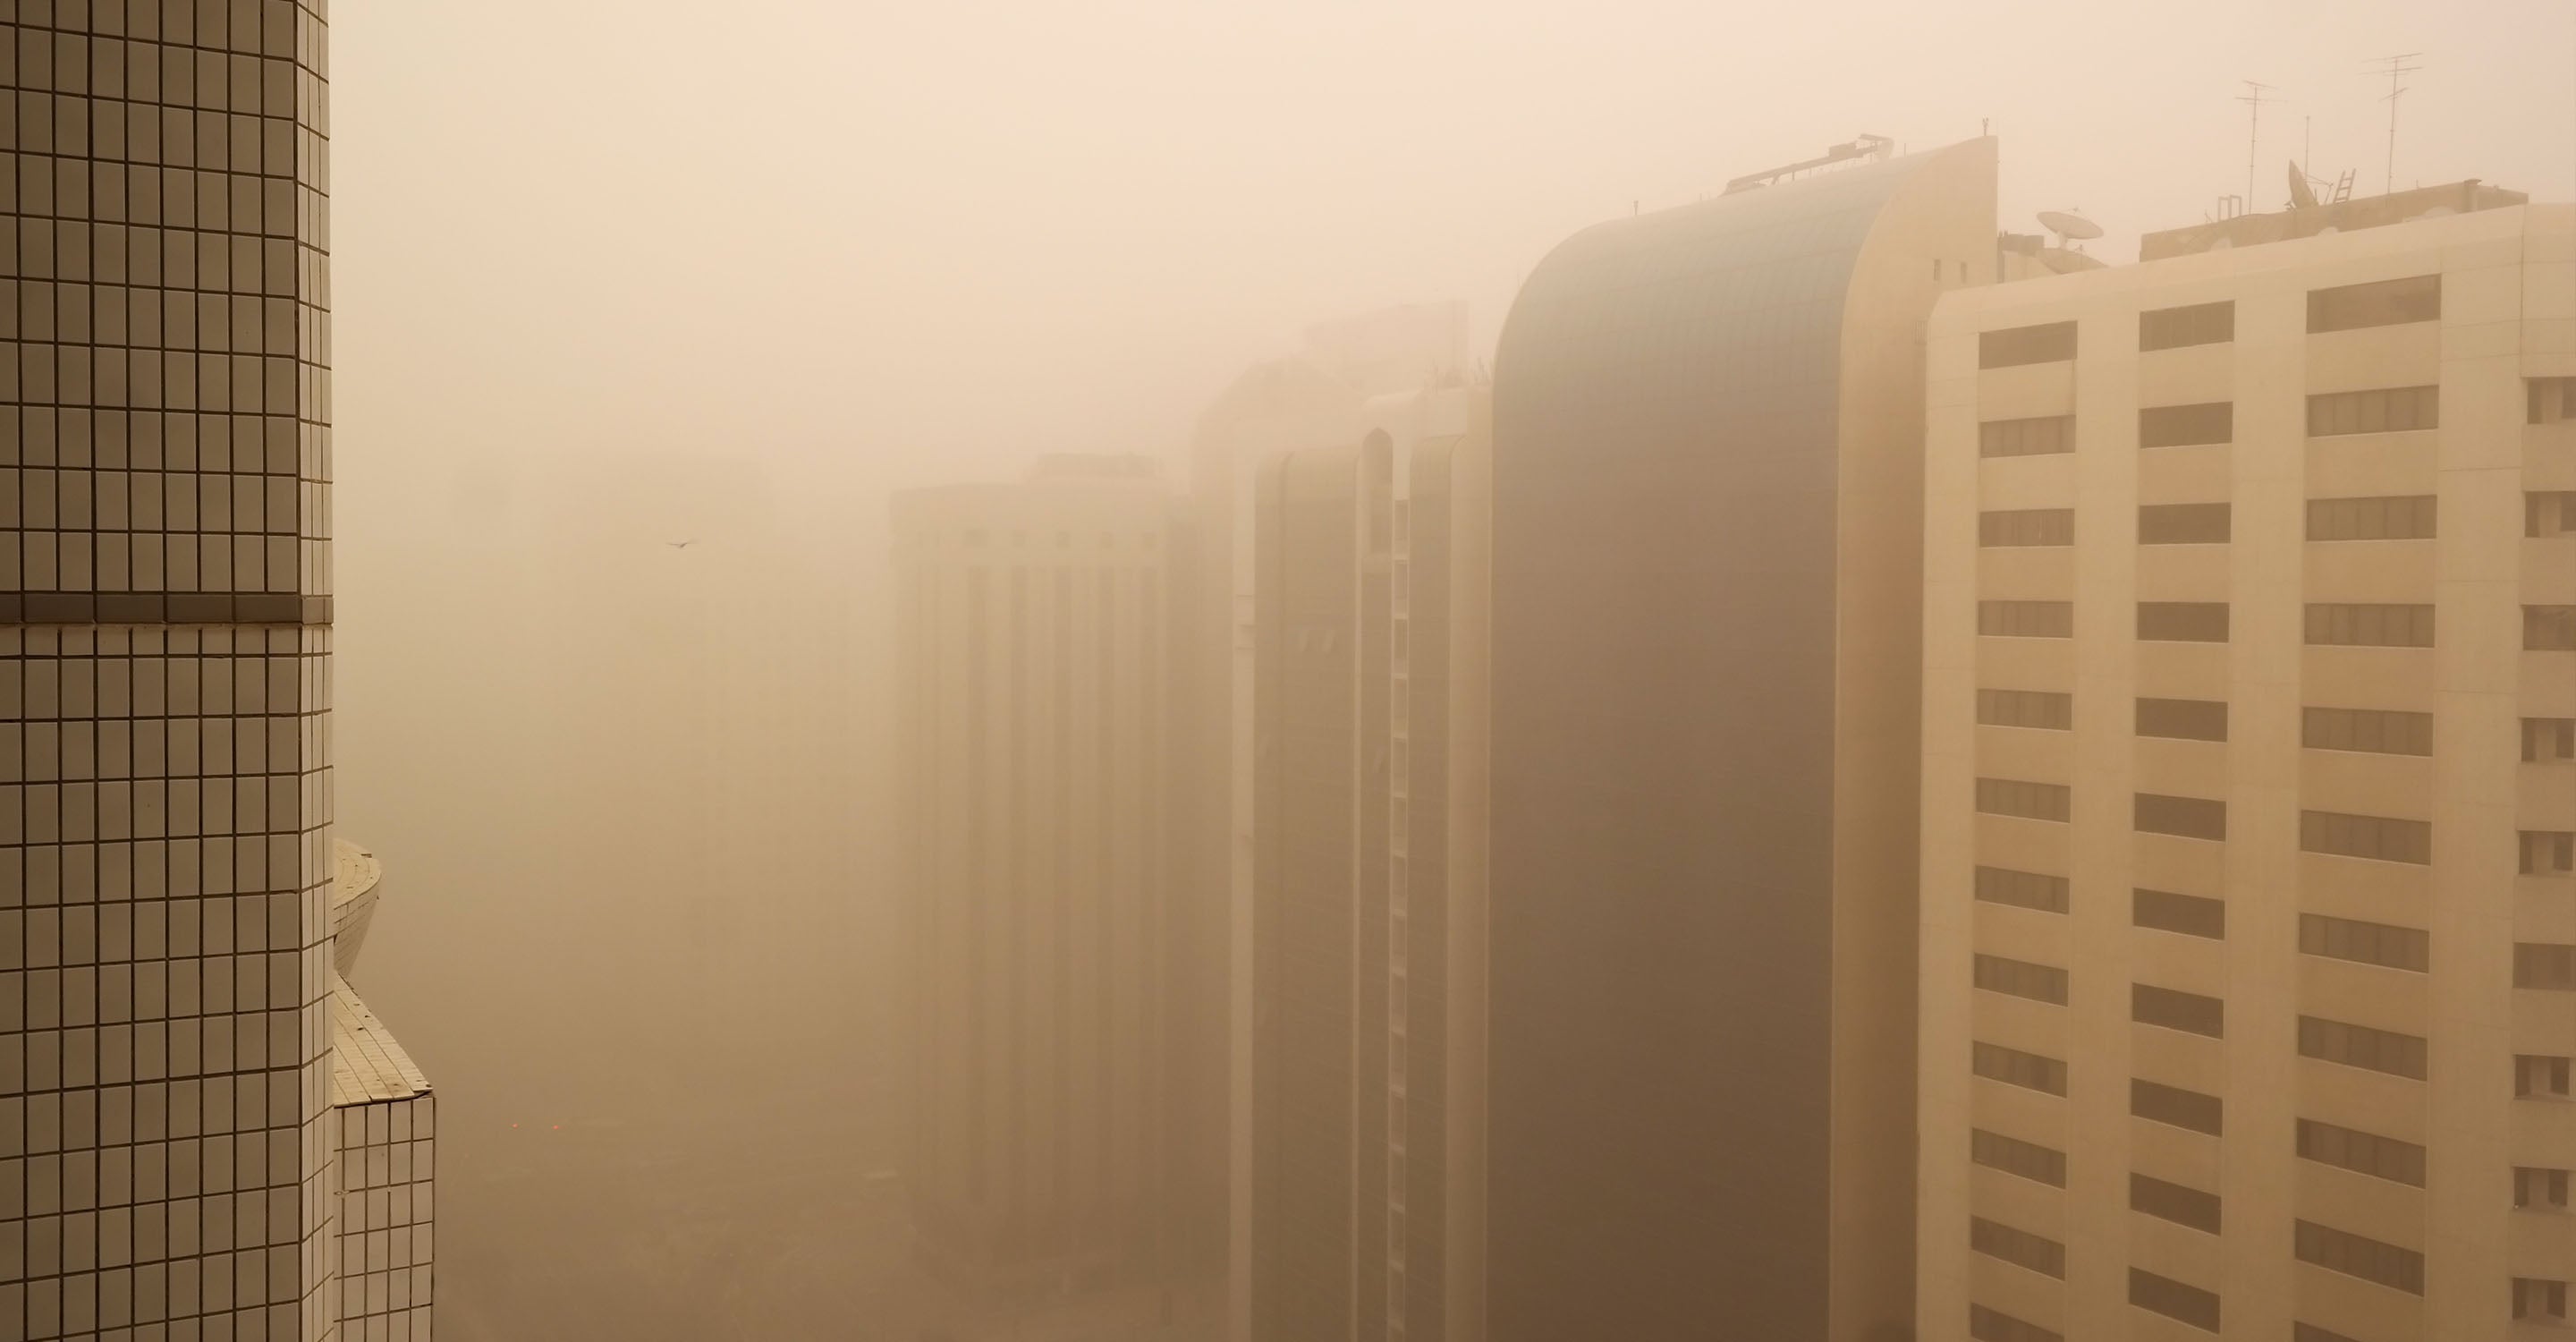
Whilst the source of the polluted air is not shown directly on the air quality map for Dong Hoi, it is generally known that in parts of the city, it is the unpaved roads that cause major problems with dust. Many areas have pools of stagnant water which dry up and create a lot of dust as traffic passes by. During the rainy season, the same road becomes slippery and dangerous which makes travelling difficult and potentially causes accidents.
According to experts, air pollution has many types such as toxic gas pollution, harmful gas pollution to health and dust pollution. In which, dust is one of the main causes of air pollution. especially in urban areas.
With fine dust, formed from substances such as carbon, nitrogen and other metal compounds (derived from burning coal, wood, straw, and garbage and from engine exhausts. This type of dust is suspended a lot in the air, small in size, and light in weight, so it doesn't settle, they float in the air. These types of dust are hazardous to health, especially PM2.5 ultrafine dust. The danger is long-term health effects, not acute problems. Because this dust is extremely small, about 30 times smaller than a human hair.
PM2.5 is always discussed on the air quality map for Dong Hoi, but how dangerous is it?
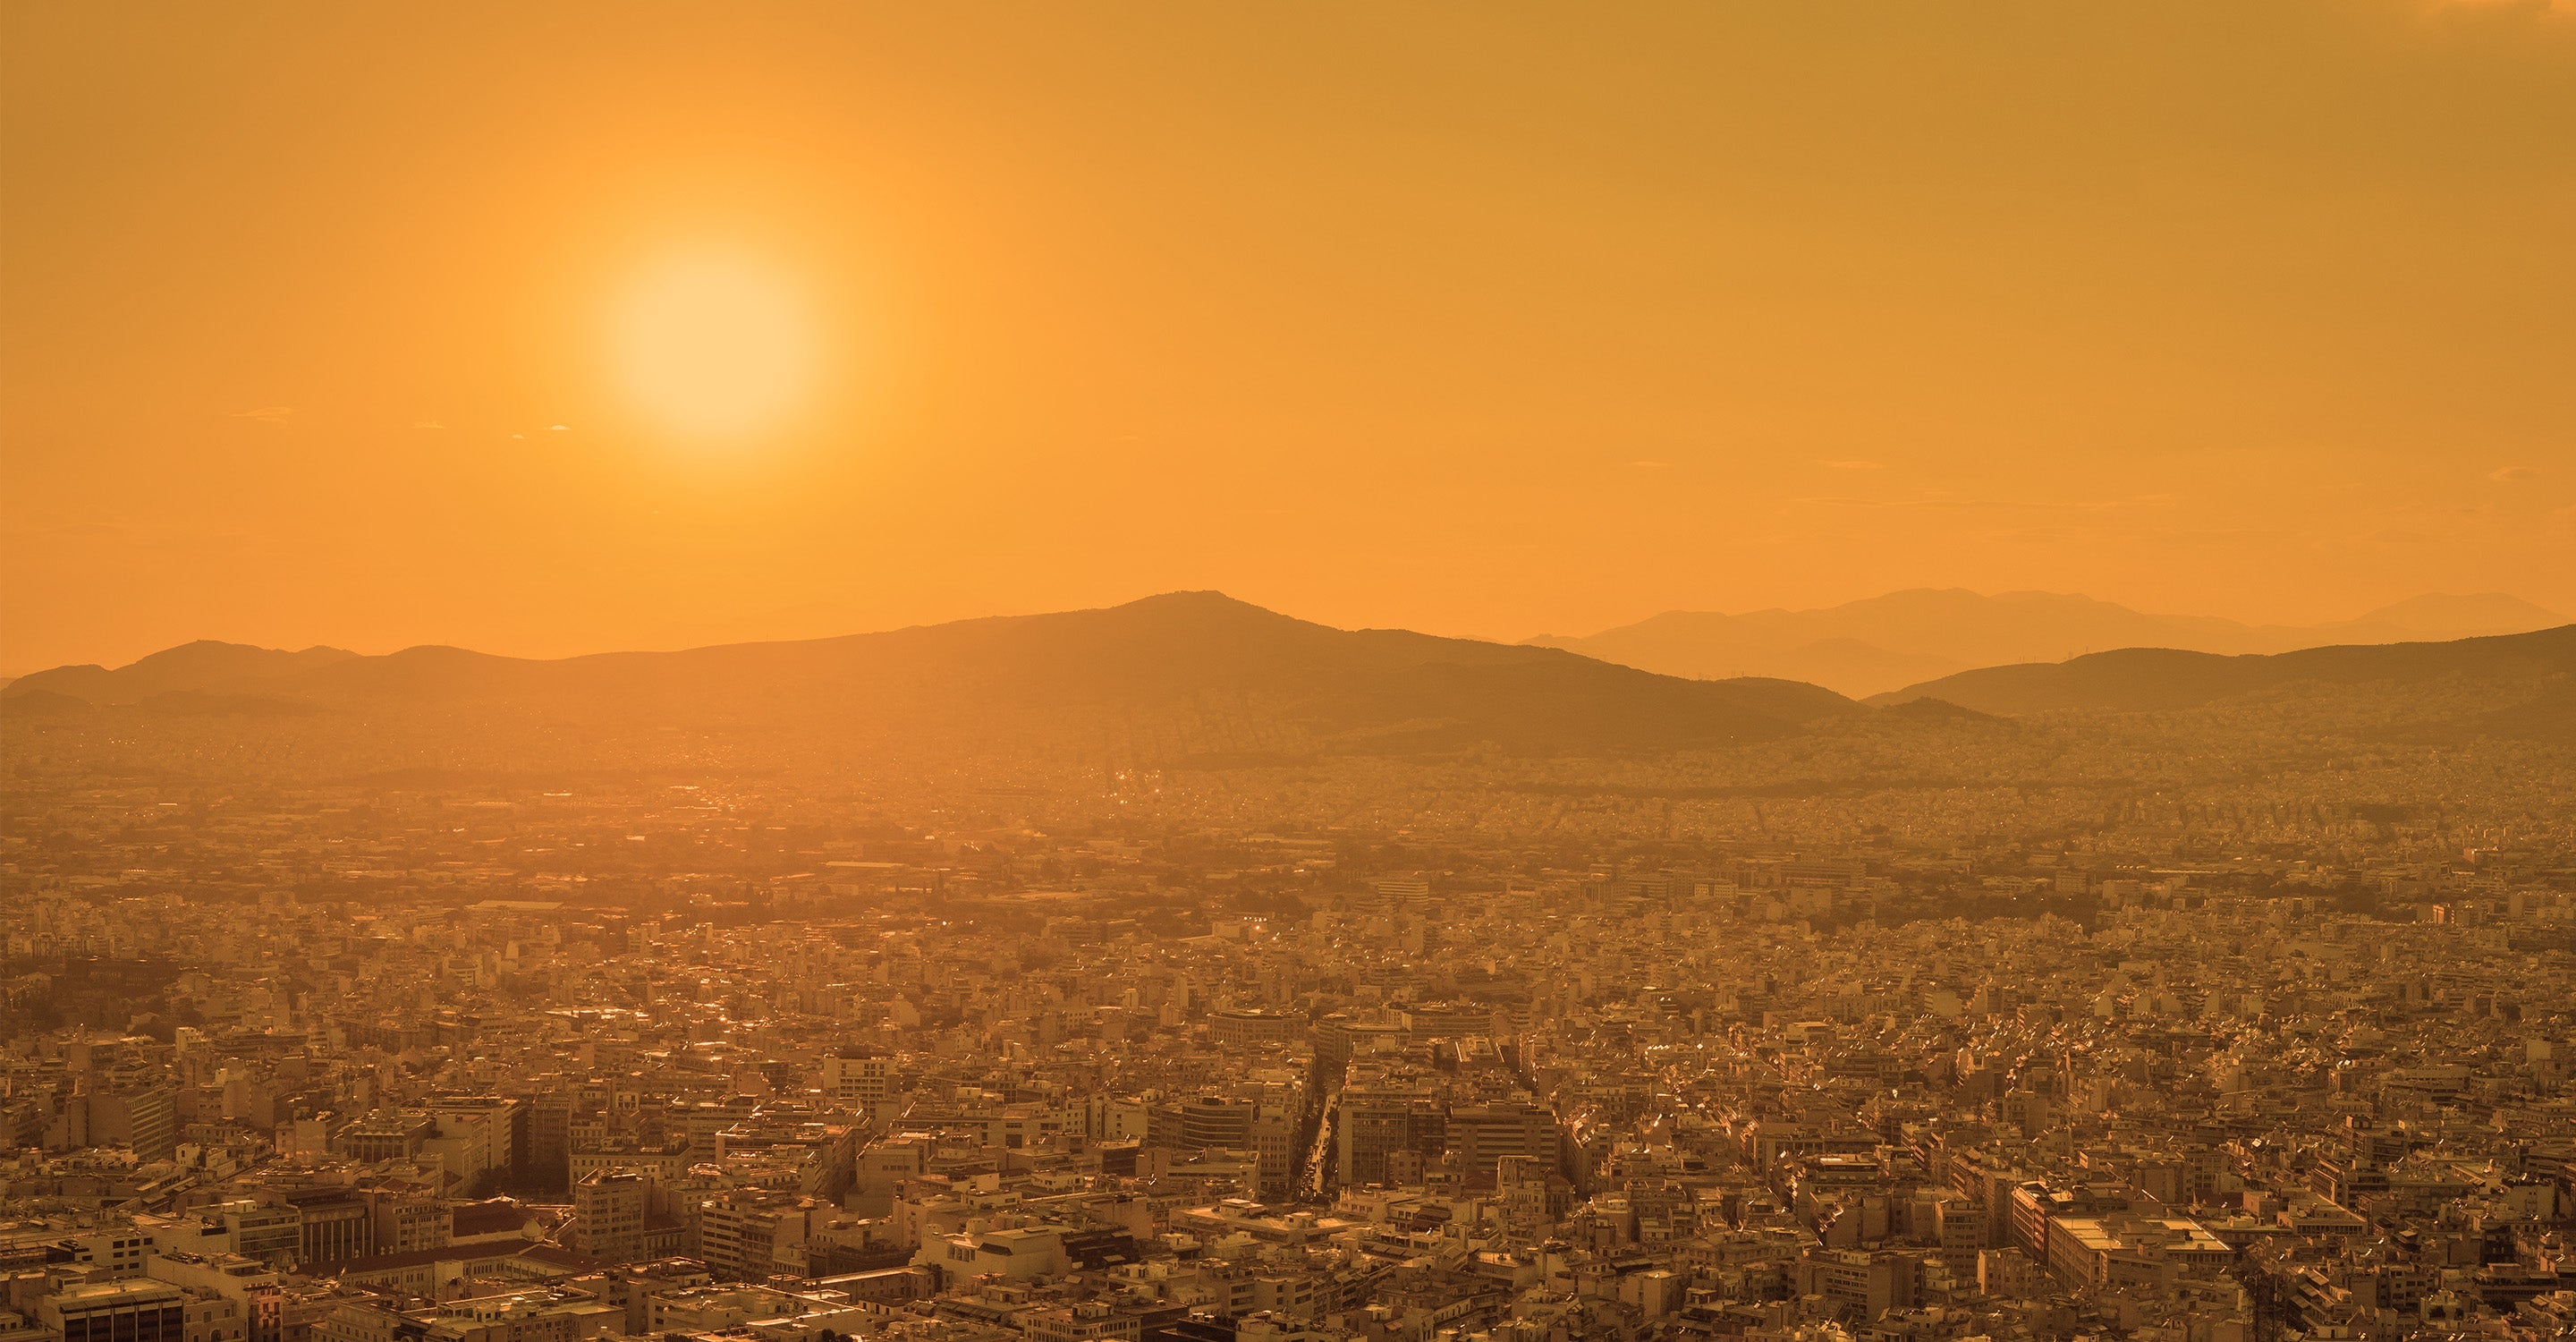
Fine particles of PM2.5 and PM10 can be generated from nature such as forest fires, desert dust, volcanic smoke, sandstorms, and tornadoes, or from biological waste such as pollen, fungal spores, etc. insect wastewater. But most dust is generated from human activities through burning charcoal, burning fossil fuels, dust from construction sites, street dust, garbage burning, industrial smoke, deforestation, and smoke.
PM2.5 and PM10 enter the respiratory tract when people breathe, but the level of penetration varies according to the particle size. While PM10 enters the body through the airways and accumulates in the lungs, PM2.5 is especially dangerous because they are so small that they can pass into the lungs, and pulmonary veins and enter the circulatory system via the alveoli at the base of the bronchial tubes.


