

Haiphong air quality map
Live air pollution map of Haiphong
142.3K people follow this city

Full screen


Contributors
2
Stations
3
Contributors category
0
Government
1
Non-profit organization
0
Educational
1
Corporate
0
Individual
0
Anonymous
Most polluted air quality stations
| # | station | US AQI |
|---|---|---|
| 1 | DEEP C III | 53 |
| 2 | QSI International School of Hai Phong | 53 |
| 3 | Hai Phong - DEEP C II Industrial zone | 50 |
community highlight
Haiphong most followed contributors
Health Recommendations
 | Sensitive groups should reduce outdoor exercise |
 | Close your windows to avoid dirty outdoor air GET A MONITOR |
 | Sensitive groups should wear a mask outdoors GET A MASK |
 | Sensitive groups should run an air purifier GET AN AIR PURIFIER |
Become a contributor
Get an AirVisual Outdoor and contribute to collecting millions of data points for the Haiphong map to track local air pollution
News
The latest air quality news and resources.


Understand air pollution and protect yourself
Haiphong MAP AIR QUALITY ANALYSIS AND STATISTICS
How does the air quality map for Haiphong show the current level of air pollution?
The air quality map for Haiphong is fully interactive and shows the various levels of air quality by the use of coloured circles. Each circle has a number on it which is the US AQI number. This is an internationally recognised calculation, involving six of the most prolific pollutants commonly found in the atmosphere. It is often used when comparing one city with another throughout the world.
The colour of the disc is graded from a pale green colour for clean air to dark maroon for hazardous air quality. It is an indication of worsening air quality as the colour becomes more intense.
When first looking at the map, other information can be seen on the left-hand side of the page such as wind direction and the location of any wildfires in the region which would affect the air quality. By choosing the “wording” these features can be turned on or off.
What information can be collected from the air pollution map for Haiphong?
When the air pollution map for Haiphong is first opened, the user will see many coloured discs overlaying each other. Only when the map is enlarged do things become clearer. Some cities have more monitoring stations than others so those pages could appear very cluttered. Each disc represents a monitoring station and conveys the information gathered by it.
To somebody who knows the area, it will be obvious that some of the darker discs are towards the outer city limits which represent the industrial zones which are often areas of elevated levels of pollution. There are exceptions, of course, as some of the older established factories now find themselves surrounded by residential areas which grew up around them. When first established these factories were on the outskirts of the ever-growing city.
Very often, these factories are encouraged to relocate through incentives or subsidies to the industrial zones just outside the city limits. This can be advantageous because their staff will no longer need to commute into the city each day and therefore reduce the amount of traffic in the city centre. Their old empty lot can be planted with trees or shrubs to break the urban sprawl and help clean the air.
Does the air pollution map for Haiphong indicate where the worst air quality is?
By looking at the map and the various coloured discs, it is known that the darker the colour of the disc, the more polluted that area is. Also, the numbers printed within the disc indicate poor air quality when the numbers become large.
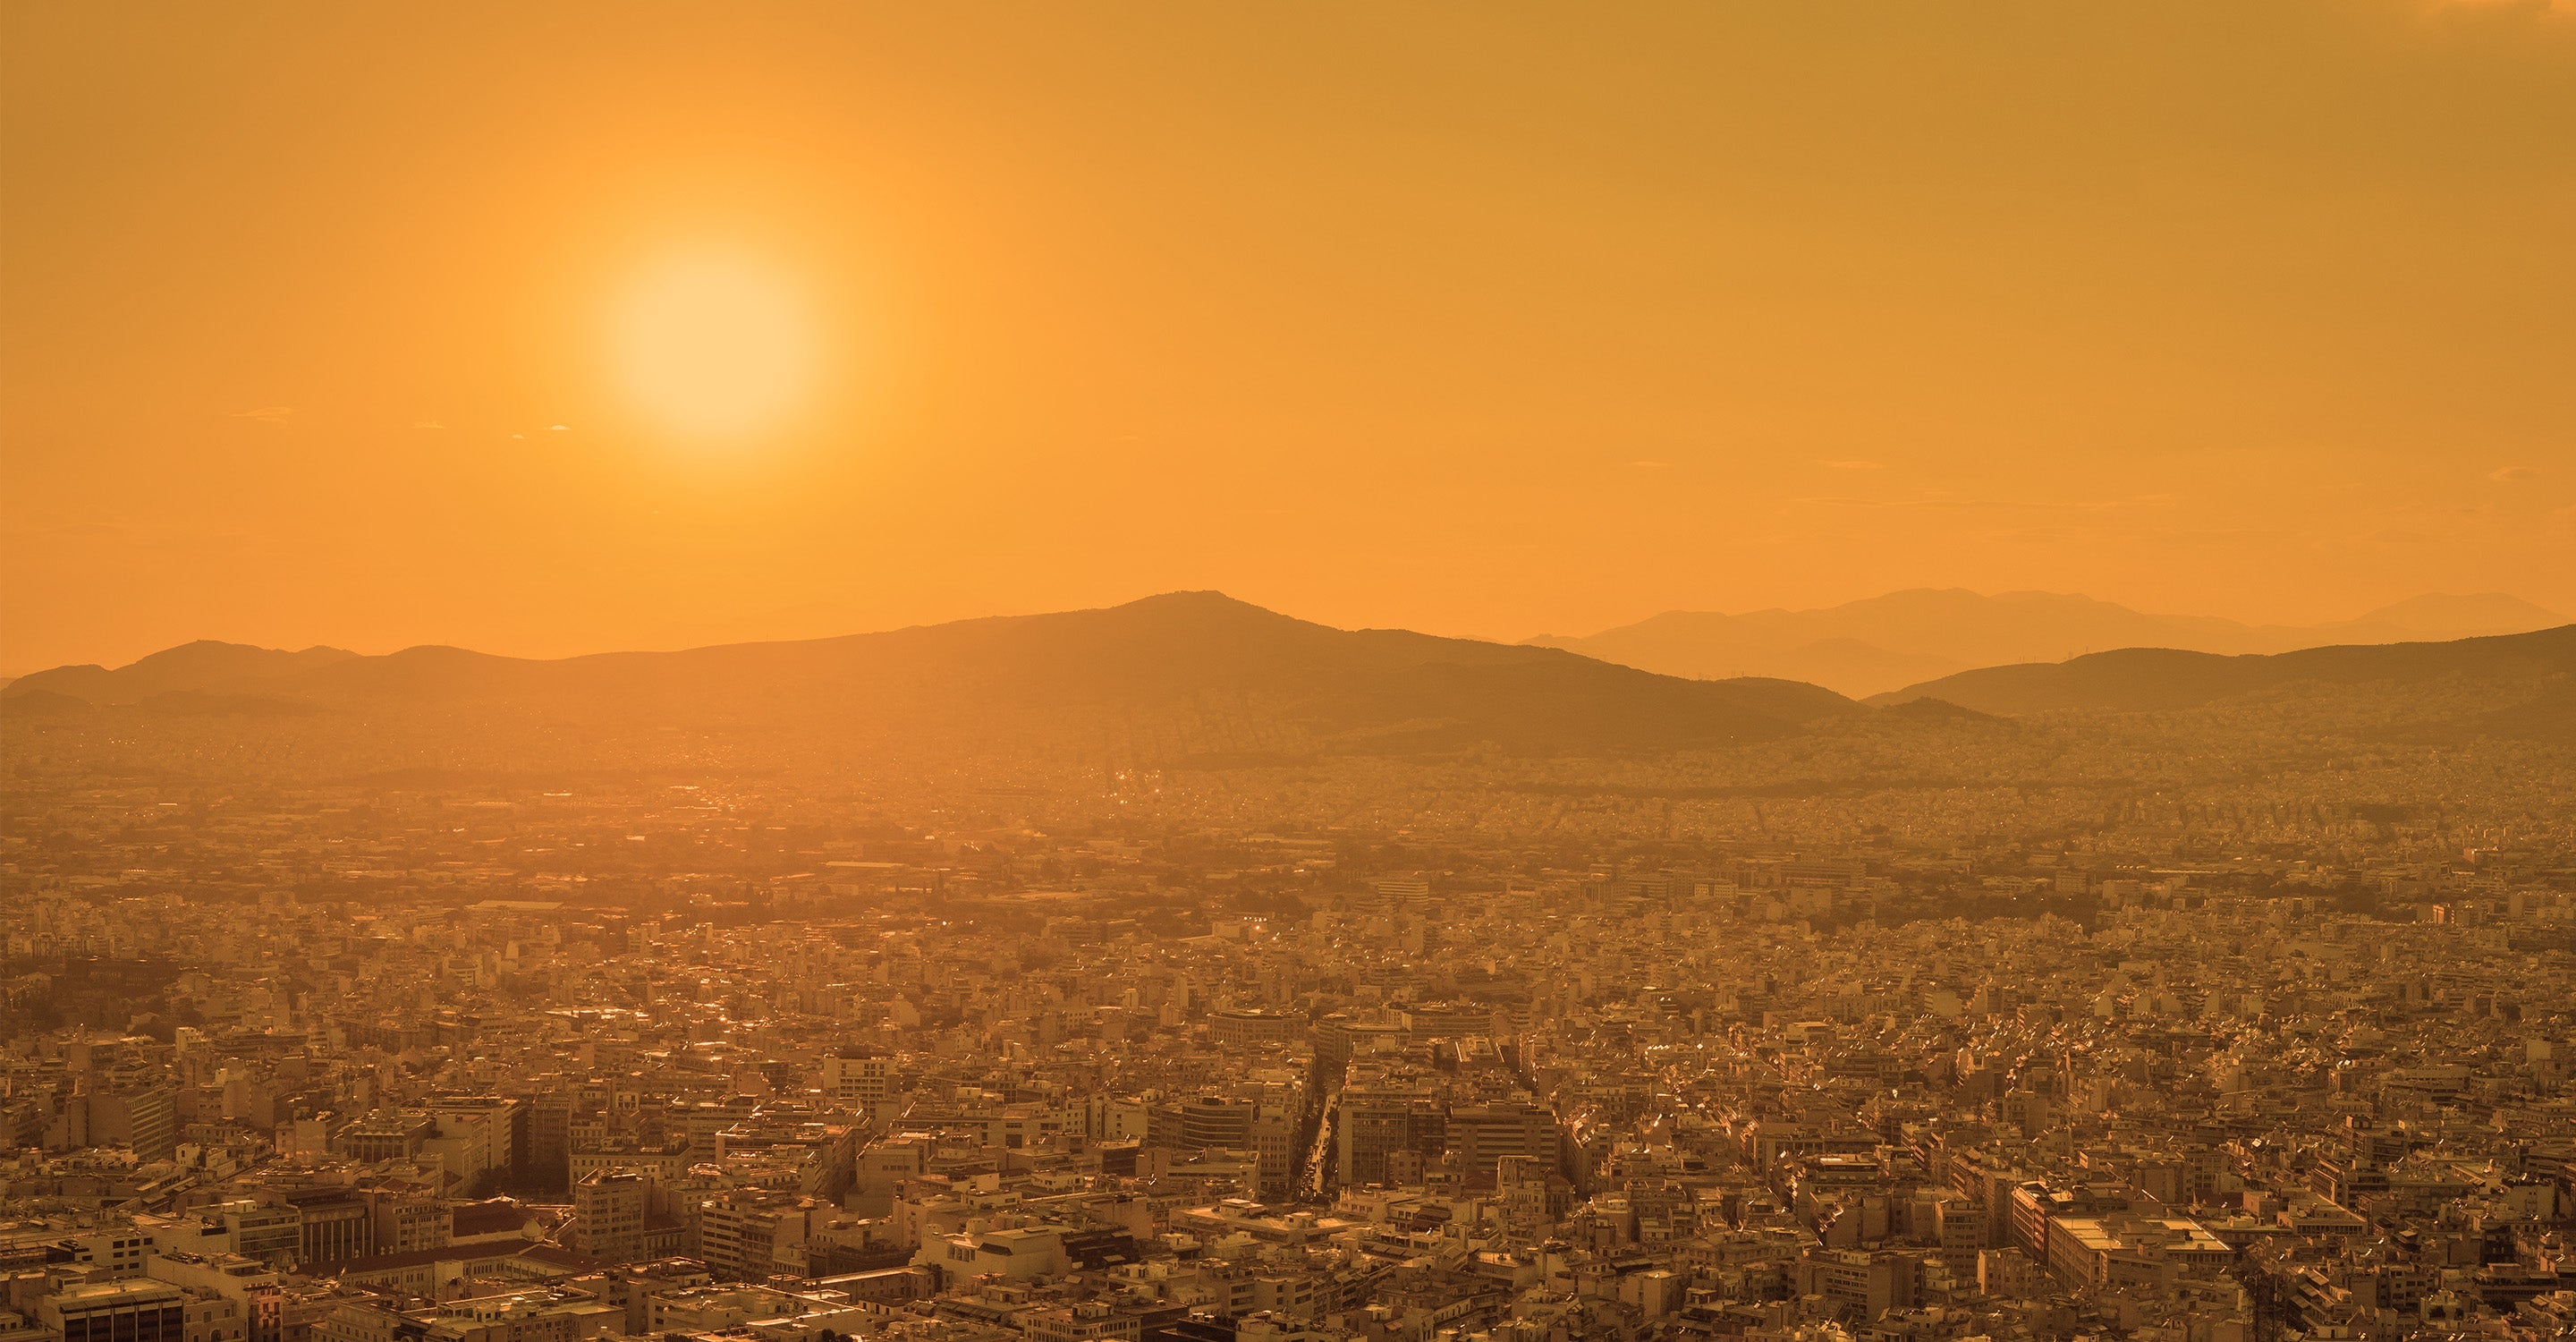
The main cause of air pollution in Haiphong is dust, emissions from vehicles, industrial activities with large emissions and not yet effectively controlled; the proportion of trees and water surfaces in the process of urban development has not met the requirements; the organisation and implementation of legal provisions on programs and tasks on air pollution control have not been synchronized and effective.
Department of industry, traffic activities, construction, propose to temporarily suspend or suspend the operation of industrial establishments, operation of establishments causing serious environmental pollution in accordance with the law, report to the City People's Committee with results from June 2021. The city has strengthened control over projects and factories with large emissions sources and high risk of environmental pollution such as coal-fired power plants, steel, chemicals and chemical fertilizers, mineral processing and mining products, cement, recycling scrap; waste treatment; encourage production facilities to replace outdated machinery and technological lines with modern ones that cause less environmental pollution, newly built facilities must install automatic emission monitoring and transmit data to the Department of Natural Resources and Environment according to regulations.
What other information can be gleaned from the air quality map for Haiphong?
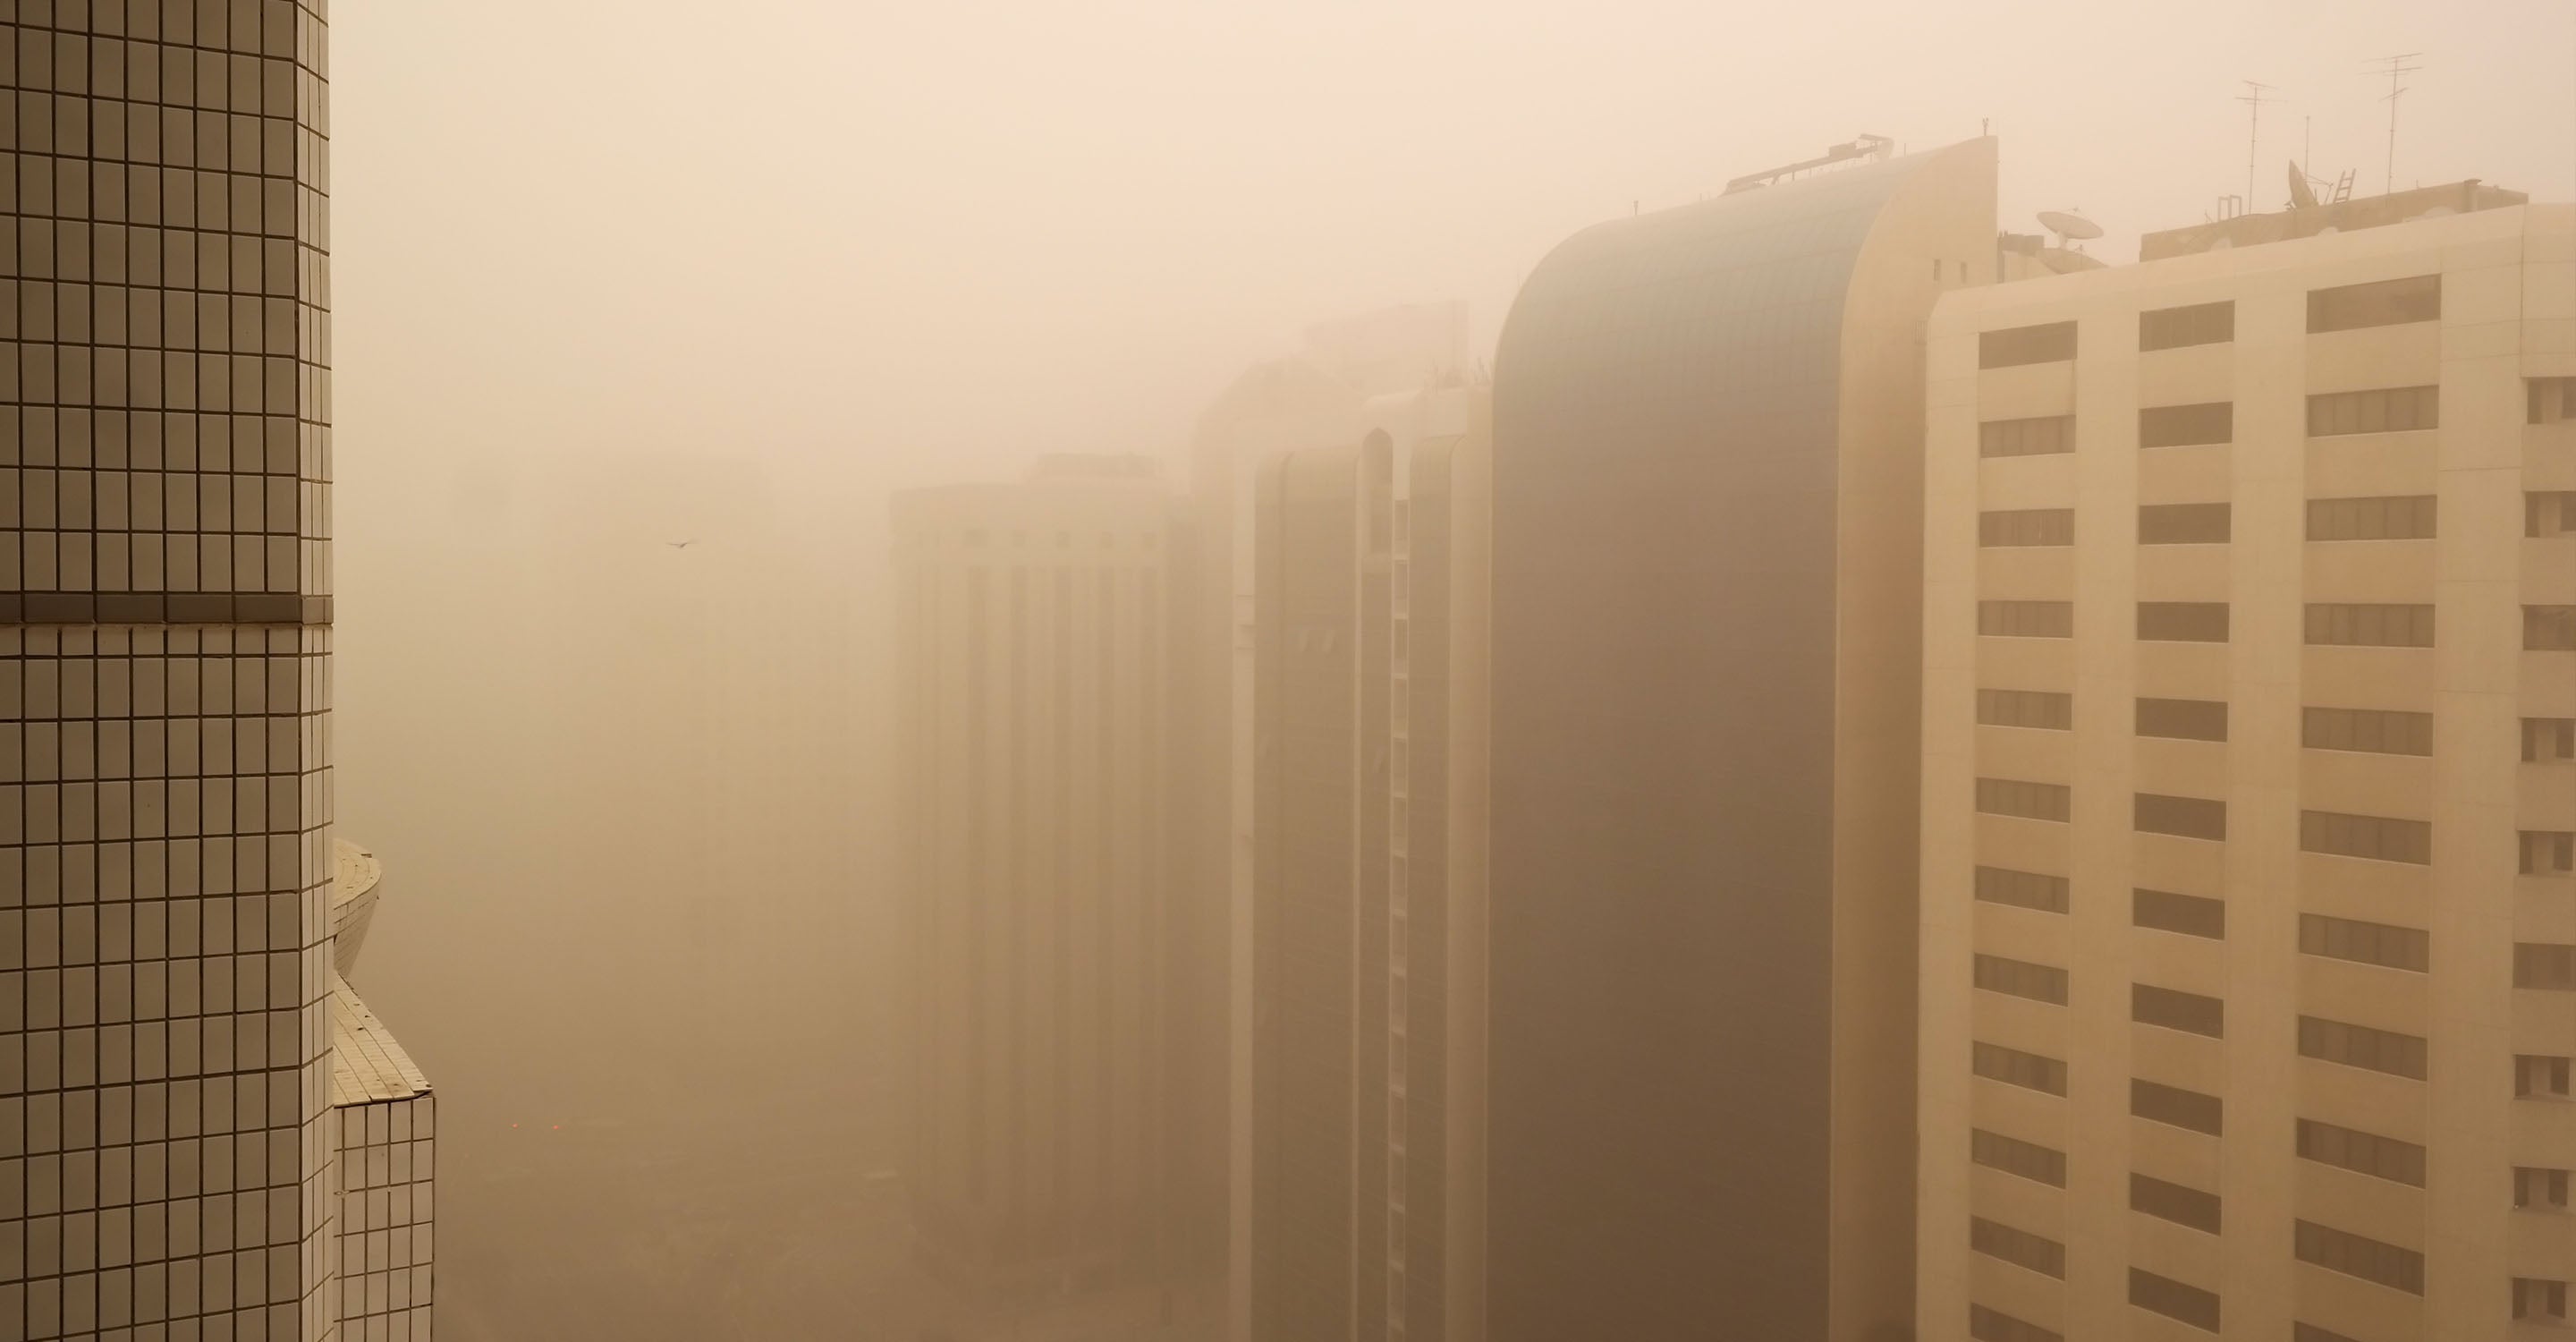
The interactive air quality map for Haiphong will show if there are any wildfires burning that will affect the air quality in the city. As of writing in the second quarter of 2022, there were three wildfires indicated on the map which were burning. The closest was just 23 kilometres away. This pushed the level of PM2.5 up to 39.2 µg/m³, which is almost eight times higher than the 5 µg/m³ target figure recommended by the World Health Organisation (WHO). The US AQI number is currently 110 which classifies the air quality as being “Unhealthy for sensitive groups”.
Very often it is not only organic matter that is burned, because people take the opportunity of seeing a burning fire to throw any garbage onto it as a means of disposing of it. This often contains old plastic bottles which produce some very nasty smoke with a high carcinogenic content. Old tyres often find their way onto these wildfires too which produce a huge amount of thick black smoke. Burning the old crop residue is seen as a way of conditioning the land in preparation for the next crop, and is unfortunately a relatively easy way to get rid of unwanted straw.
Large wildfires worldwide are largely caused by abrupt climate change. Sudden climate change releases a large amount of dust into the environment, leading to serious air pollution.
We always see PM2.5 on the air pollution map of Haiphong, but what is it?
PM2.5 is the cause of blood poisoning, making blood difficult to clot, affecting the circulatory system, weakening the nervous system that controls the activity of the heart muscle and causing cardiovascular diseases. Fine dust particles enter the body, reduce lung function, and cause bronchitis, asthma and lung cancer. At the same time, making the condition worse and possibly fatal. Causes foetal growth retardation. Babies born with low birth weight are more likely to have nervous breakdowns and autism. In addition, PM2.5 also contains many heavy metals capable of causing cancer, or affecting DNA and causing genetic mutations.
Around October - November of the year, fog often appears. These thick layers of fog contribute to the accumulation of dust inside the city that cannot escape, thereby making the city covered with a thick layer of dust.
Haiphong air quality data attribution
2Contributors
- QSI International School of Hai Phong
1 station
Non-profit organization Contributor
 DEEP C Industrial Zones-Hai Phong
2 stations
Corporate Contributor
1 Data source
 Data validated and calibrated by IQAir
Where is the cleanest air quality in Haiphong?


