
Bandung air quality map
Live air pollution map of Bandung • 461.7K Followers • 20:00, Aug 02 Local time


Stations
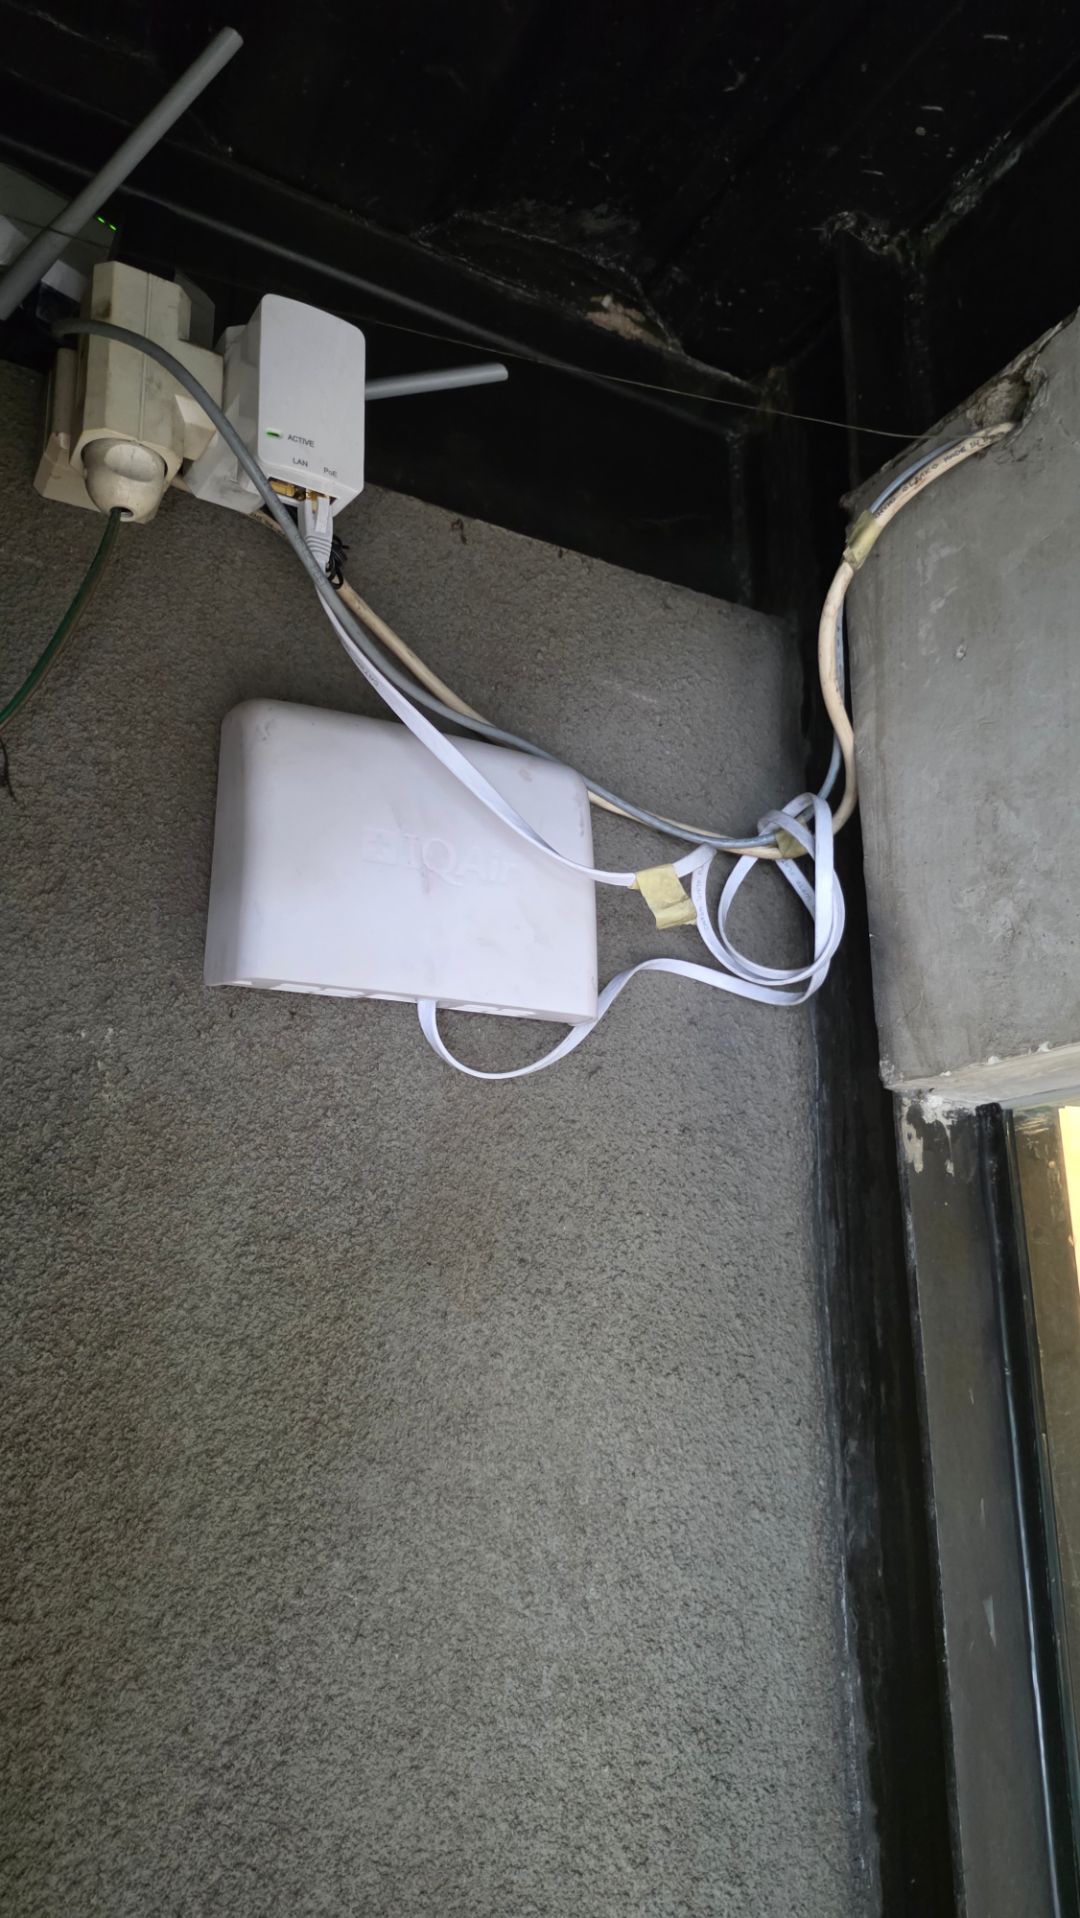
Clean Air Facilities
Contributors
Government
0Diplomatic
0Non-profit
0Education
0Corporate
3Healthcare
0Hospitality
0Individual
1Top contributors in Bandung
Who is sharing outdoor air quality data in Bandung?
Featured station
Discover some of the best station installation in Bandung
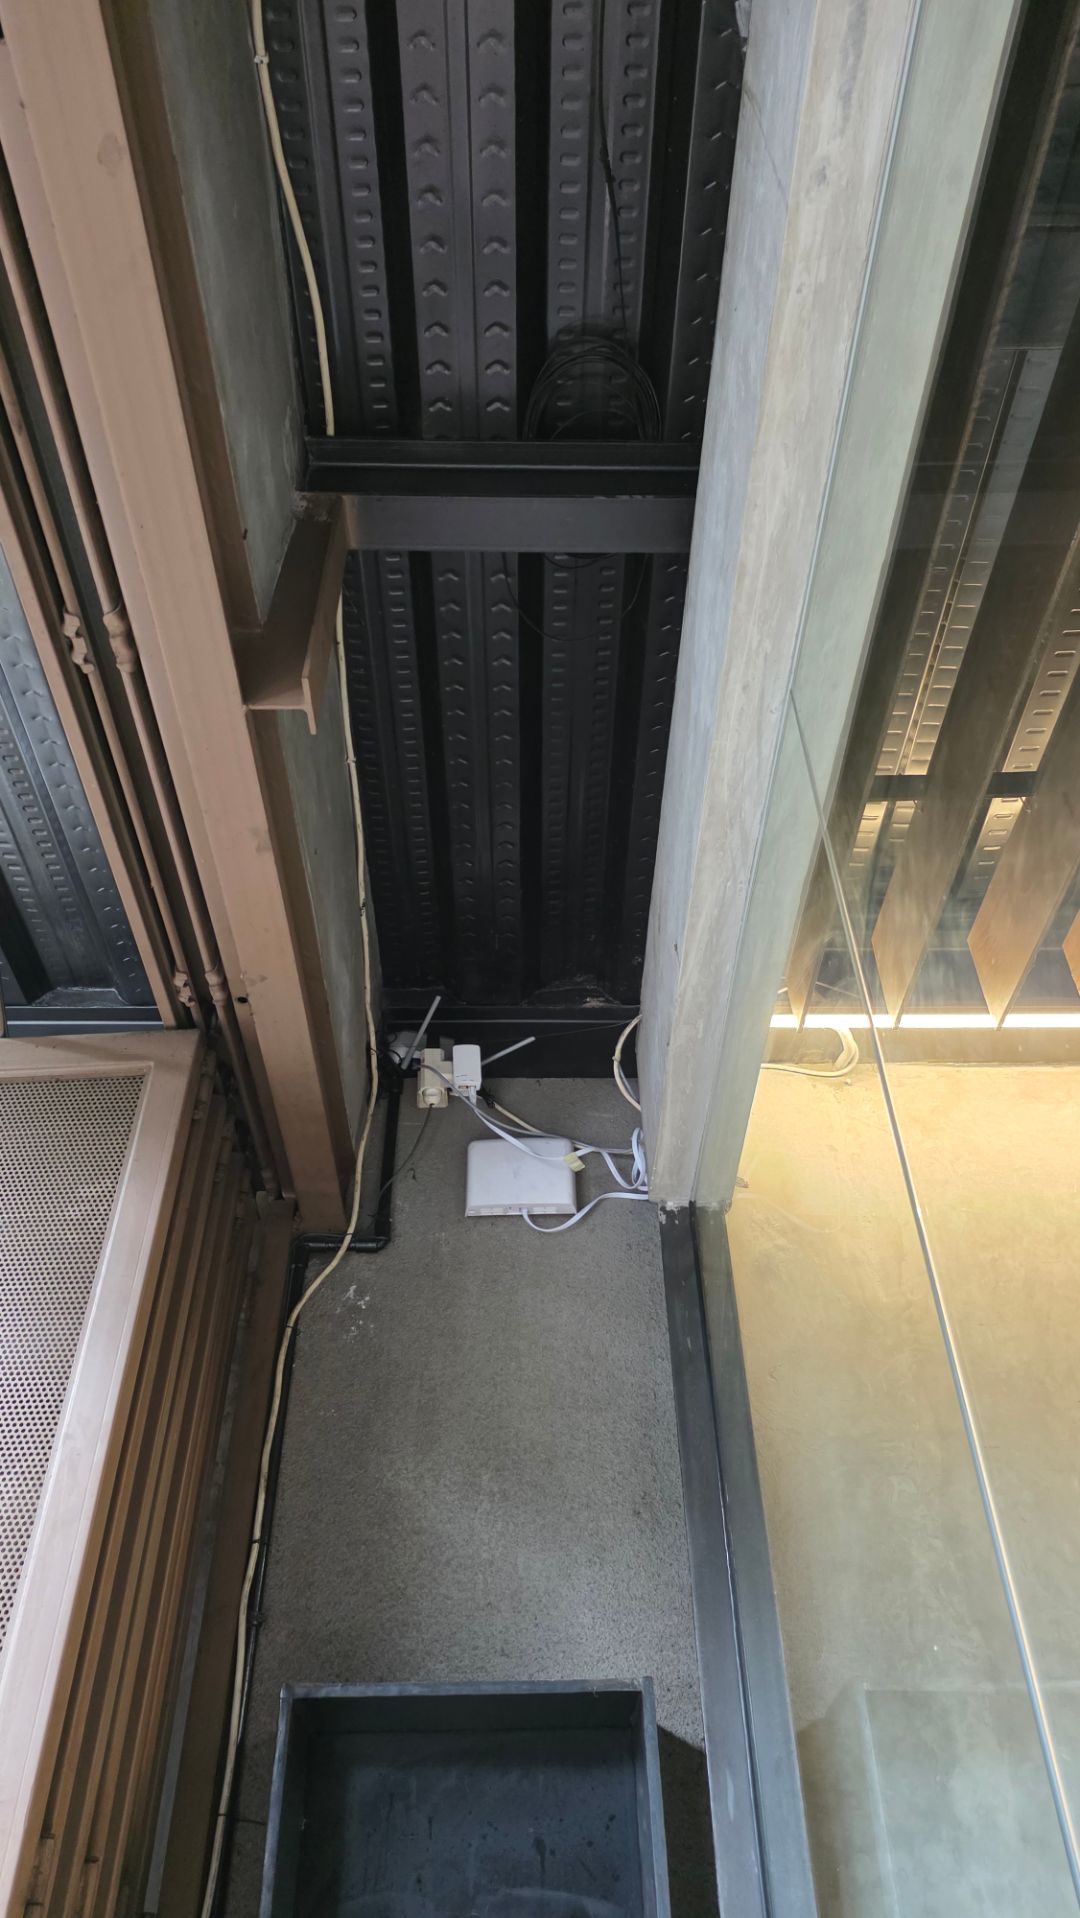
Station gallery

Ateson Home Bandung, Bandung
156
Newest stations deployed in Bandung
AQI⁺ station ranking


Learn more about global air quality


Learn more about air pollution in Bandung
What are the air pollution levels in Bandung now?
Bandung is one of the most populous cities in Indonesia, being the capital of the west java province. It has a high level of elevation above sea level and thus has much cooler temperatures than are usually seen in the rest of Indonesia. When looking at the pollution levels that Bandung is subject to, it is noticeable that there are large levels of fluctuations occurring on a daily basis, with readings as low as 4.7 μg/m³ being recorded in the latter part of 2020, and highs of 41.3 μg/m³ being recorded only a few days prior to that.
This shows that there are some pollution problems that cause the large spikes of PM2.5 as shown above. The reading of 41.3 μg/m³ is enough to put Bandung into the ‘unhealthy for sensitive groups’ bracket which requires a PM2.5 reading of anywhere between 35.5 to 55.4 μg/m³. This means that those who have sensitivity towards the chemicals found in smoke and haze would be at risk in terms of their health, with this group often containing demographics such as young children and the elderly, as well as the immunocompromised or those suffering from respiratory ailments.
What are the main causes of pollution in Bandung?
Bandung finds itself with many causes of pollution, some being more pertinent on certain days than others, with other factors such as weather (humidity, wind speed and rainfall) all factoring in to how bad a single day’s pollution can be. Generally, due to being such a highly populated city, Bandung would receive a large amount of its year-round pollution from exhaust fumes given off by cars, motorbikes and trucks. Traffic is a constant cause for concern regarding pollution levels, with rush hours often seeing drastic increases in the amount of pollution levels in the air.
Leaded fuels, as well as fossil fuels such as diesel are an ongoing issue with increased pollution levels, due to vehicles running on these (in particular diesel, due to leaded fuels having been phased out in 2006), emitting far greater quantities of pollution that alternative and more ‘green’ fuel sources. Whilst 2020 has been witness to the COVID-19 era, there should be a marked decrease in traffic related pollution yet there are high levels still being recorded across the city.
Other causes of air pollution in Bandung include the industrial sector, with many factories being located within the city, as well as construction sites, as with an ever-growing population comes an ever-growing demand for new houses, condominiums as well as shopping centers and the like. Construction sites can contribute to pollution levels particularly when they are badly maintained, with microscopic particles of ground up cement, microplastics as well as toxic metals such as lead and mercury making their way into the atmosphere.
What is Bandung doing to reduce its pollution levels?
Bandung in the past has received awards in regards to how clean its air quality has been, being lauded as one of the cleanest ASEAN cities in 2017. However as with all things they are subject to change, and Bandung's high readings as of late show that the pollution levels are still fluctuating in a way that do not directly benefit its citizens. There are still ongoing programs happening that are aimed directly at reducing air pollution levels, such as car free days across several different locations across Bandung, usually taking place on Sundays so as not to interfere with weekly commutes. With initiatives aimed at directly reducing the number of cars at any given time, these often see success in reducing pollution levels by a significant amount when they are employed, however a switch to more sustainable alternatives such as more infrastructure in public transport as well as the use of electric cars could really lead to a more permanent fix in Bandung's pollution levels.
What are the main types of pollution found in the air in Bandung?
With car exhaust fumes being ever present in the city, they would present with pollutants such as nitrogen dioxide (NO2) and sulfur dioxide (SO2), with the first being most prominent in the atmosphere in areas that see high levels of traffic. Bandung is currently going through a construction boom, with a huge demand for high rise buildings across the city. As such the number of construction sites will increase, and thus the levels of pollution associated with them will also rise. Pollutants that find themselves coming from construction sites include a wide variety of fine particulate matters, such as silica dust, finding its source from the drilling or sanding of materials such as concrete, sandstone or mortar.
Another type of construction related pollution that is less well known but becoming more prominent as a pollutive issue is that of poorly maintained construction sites, where huge piles of dirt and sand are left uncovered and exposed to the elements. Here vast amounts of very fine particulate matter including PM2.5 can be swept up into the atmosphere and be respired by Bandung's citizens, leading to a host of respiratory problems due to the materials extremely small size.
Other industries such as factories and production plants contribute to the pollution levels, with a large number of both across the city. Machines at construction sites as well as the generators for these factories both run on fossil fuels such as coal and diesel, which release a large amount of their own pollution into the air including ones such as black carbon and volatile organic compounds (VOC’s), both of which have highly negative effects when inhaled.
What are some health problems associated with breathing polluted air in Bandung?
Whilst Bandung does have days that have an extremely good quality of air, as well as being renowned for its clean air in the region, there are days where the pollution levels rise and as such so does the chance of developing negative symptoms related to the breathing of these toxic fumes and smoke.
Health problems would include ones such as emphysema, bronchitis, aggravated asthma attacks as well as a reduction in full lung function, which can have a whole host of negative effects on young children who are still developing, leading to growth related issues as well as cognitive defects.


