
Tangerang air quality map
Live air pollution map of Tangerang • 232.5K Followers • 23:00, Jul 29 Local time


Stations
Clean Air Facilities
Contributors
Government
1Diplomatic
0Non-profit
0Education
1Corporate
1Healthcare
0Hospitality
0Individual
1Top contributors in Tangerang
Who is sharing outdoor air quality data in Tangerang?
Featured station
Discover some of the best station installation in Tangerang
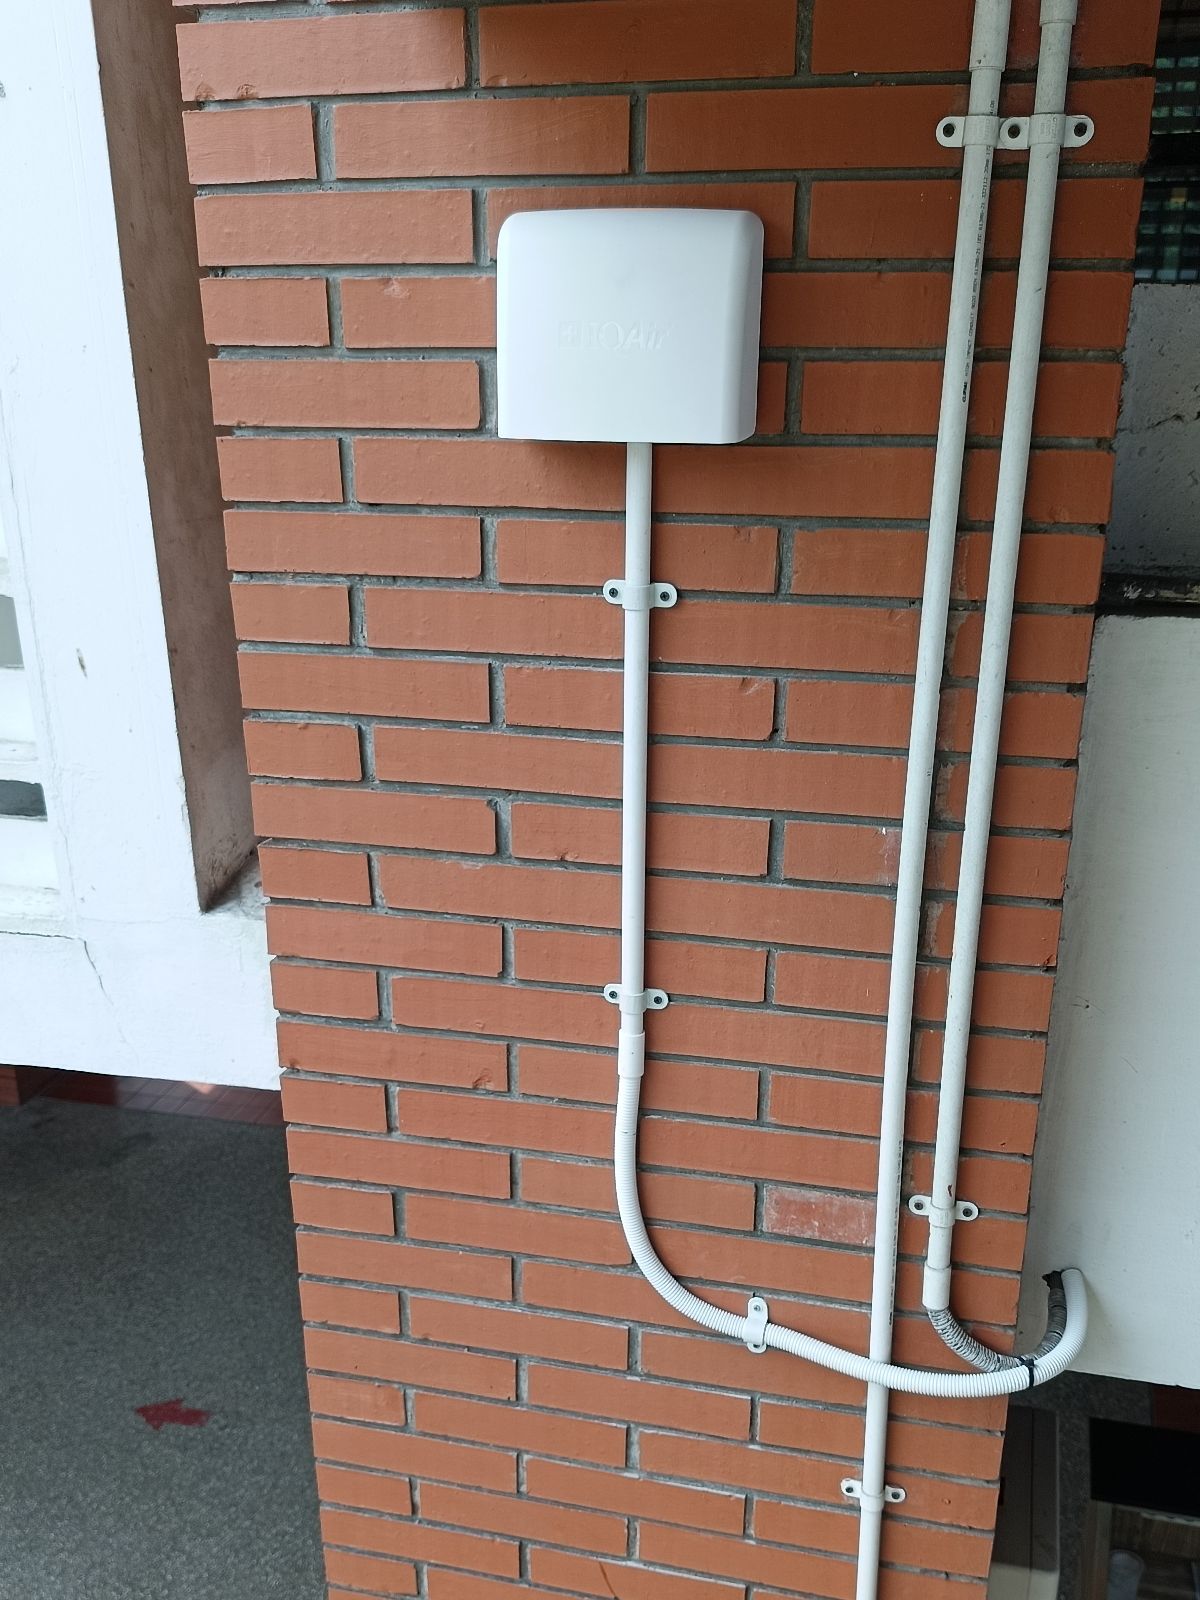
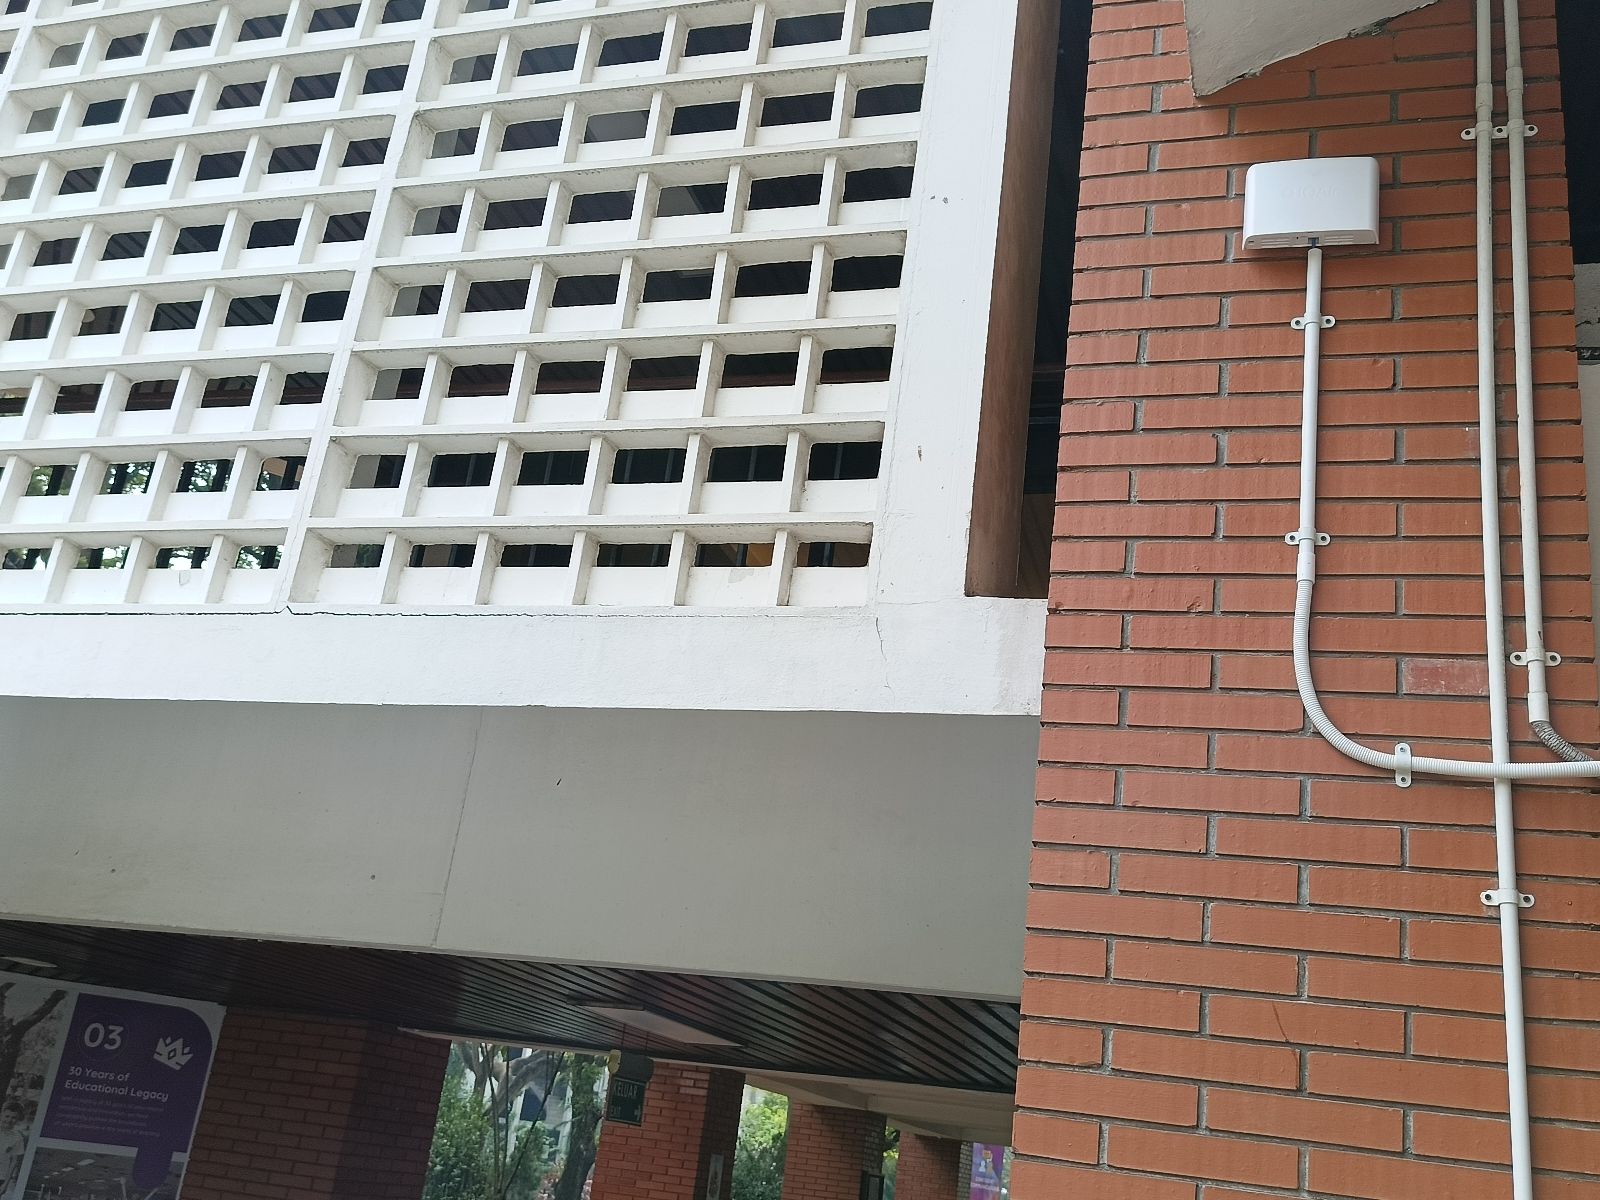
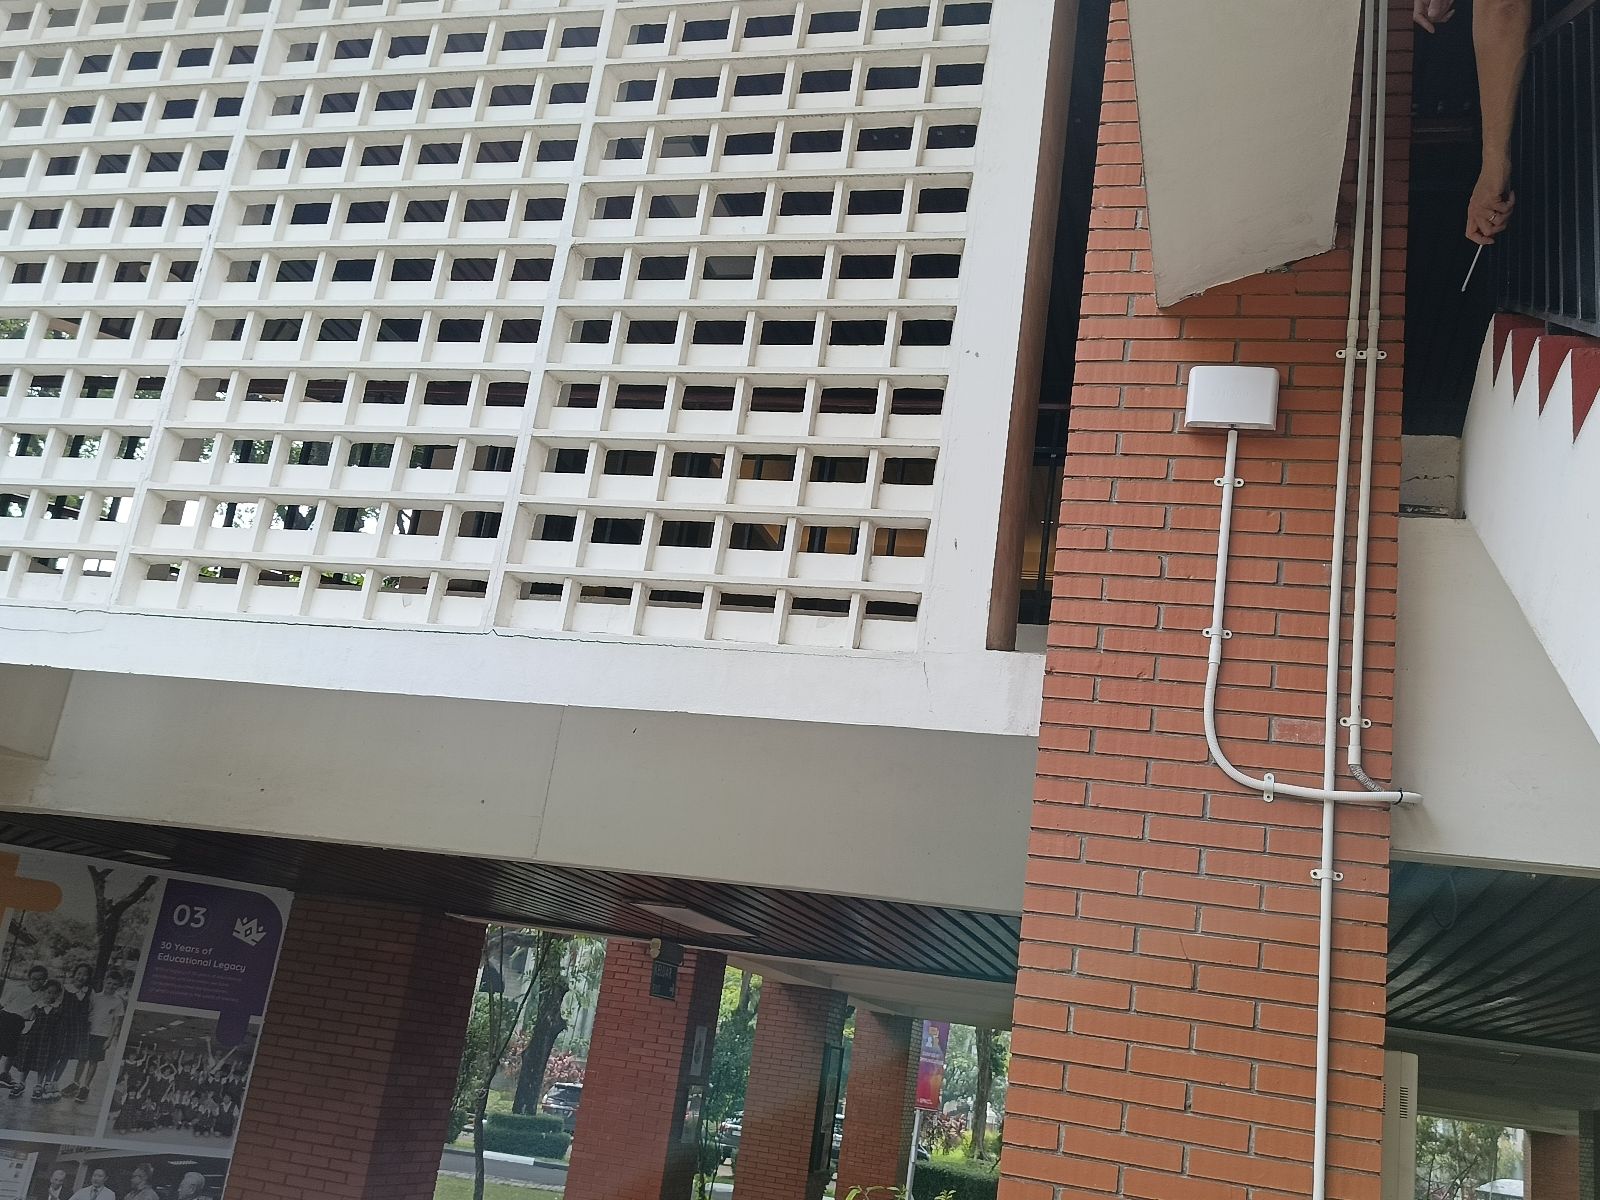
Station gallery

SPH LV, Tangerang
153
Newest stations deployed in Tangerang
AQI⁺ station rankingNewest stations


Learn more about global air quality


Learn more about air pollution in Tangerang
What is the air quality index of Tangerang?
Tangerang is an Indonesian city on the western border of Jakarta, in the province of Banten. It is the 6th largest city in Indonesia and the largest city in Banten. In 2020, the population was said to be over 2.3 million people. At the end of this year, the US AQI index recorded a figure of 34 which is classified as “Good” according to the recommended levels by the World Health Organisation (WHO). The figures vary from a low of 34 to a high of 72 in the first two weeks of December.
Looking back over figures recorded during 2019 we can see that for 10 months of the year, the air quality was in the “Unhealthy” bracket ( 55.5-150.4 µg/m³) and the remaining two months were not much better with figures in the “Unhealthy for sensitive groups”, (25.5-55.4 µg/m³). These figures classed Tangerang as the most polluted city in Indonesia this year.
South Tangerang occupies the first position of the most polluting cities with an average PM2.5 of 81.3 µg/m³). South Tangerang is on the list of the top 30 cities with the worst air quality in the world, occupying the 24th position.
What are the main sources of air pollution in Tangerang?
As with most developing nations most air pollution is caused by two main causes, transportation and industry. Tangerang is no exception with a large industrial park which is home to over 1,000 units. Because of its close proximity to Jakarta, many businesses find it cheaper to rent space here, than in Jakarta where rents are considerably higher.
There are two major highways running very close to Tangerang from Jakarta. The busiest one has three exits points which lead directly to Tangerang city and the second one incorporates the ring-road and offers toll access to Jakarta, Bogor and Bekasi.
Add to these, a comprehensive bus network and an international airport and the poor air quality is understandable.
Is the air quality in Tangerang getting better or worse?
The National Nuclear Energy Agency (BATAN) studied pollution in many Indonesian cities and noted that the highest lead (Pb) concentrations were in Surabaya, Tangerang and Jakarta. The lead content due to air pollution in the three regions was recorded higher when compared to other similar areas. In fact, various research by international institutions has shown that lead (Pb) pollutants not only have a negative impact on human health but can also affect children's intelligence. One of the important parameters that became the focus of BATAN research was the monitoring of heavy metal contamination, especially Lead (Pb) in PM-2.5 particulates. Lead (Pb) that is in the air when inhaled and accumulates up to 10 µg/m³ in a child, can result in decreased intelligence levels, learning disabilities, showing symptoms of anaemia, inhibition in growth, poor cognitive development, weak immune system and symptoms of autism. Therefore, one of the recommendations from the results of BATAN's research is the importance of using unleaded fuels. The government's programme of using unleaded gasoline, which has been in effect since July 2006, is very good for the environment.
This is not the case in other cities where the levels of lead are as high now as they were. This is mainly due to the continuing use of adulterated fuels. By adding cheap hydrocarbons to gasoline, it can show considerable cost reductions over a period of one month. This is very important to a low-wage earner.
What can be done to improve Tangerang’s air quality?
Intersections that are prone to traffic congestion will soon be monitored by CCTV cameras to try and alleviate the situation. Cars caught up in congestion rarely turn off their engines but leave them idling because they continue to run the air conditioning system. This system is known as the Intelligent Transport System (ITS) and could reduce the rate of congestion by 30 per cent.
Known as the Blue Sky Program which was held from 13th September 2020 to 12th November 2020, PT Pertamina (Persero) invited the people of South Tangerang to use higher quality vehicle fuel (BBM), such as the Pertamax Series and Dex Series. By using higher quality fuel, it is hoped that fewer vehicle exhaust emissions would be produced and thus reduce air pollution.
In the Blue Sky Program in South Tangerang, Pertamina provided a 30% cashback promotion for users of black plate vehicles or private vehicles who bought Pertamax, Pertamax Turbo and Pertamina Dex fuels. The requirements were easy, the BBM purchase transaction process had to use the MyPertamina application, which was downloadable as an app to a smartphone. This 30% cashback promo lasted until 30th September 2020 and was considered to be very successful.
For residents who live in Tangerang city, they no longer need to worry about knowing what the quality of air is. Tangerang Live can be downloaded from Google Play and installed on a smartphone. Once opened the user can very easily find out what the quality of the air is and make an educated decision as to what to do.
In the application, the levels of dust or particles (PM10), sulphur dioxide (SO2), carbon monoxide (CO), ozone (03) and nitrogen oxides (NO2) will also be seen.
What are the health effects of Tangerang’s polluted air?
The health effects of Tangerang’s polluted air depends on the person. A strong, healthy person will be less affected than a frail senior citizen. Other factors to take into consideration are the type of contaminants inhaled and the length of exposure to the pollutants.
Levels of high air pollution can have an immediate effect especially to those who have existing respiratory problems. The heart and lungs will become stressed as they try to attain the levels of oxygen needed to keep the body alive. When pollutants enter the airways and bloodstream, they can easily damage the cells.
Longer-term exposure leads to the acceleration of the ageing process of the lungs, which in turn, leads to a loss in lung capacity and a decrease in its ability to function efficiently.
Different groups of people react in different ways to air pollution. The most susceptible groups are pregnant women, children under the age of 14, outdoor workers and senior citizens. And those who already suffer from emphysema, asthma or chronic obstructive pulmonary disease (COPD).


