Multan air quality map
Live air pollution map of Multan
5.5K people follow this city
Full screen
Contributors
1
Stations
1
Contributors category
0
Government
0
Non-profit organization
0
Educational
0
Corporate
1
Individual
0
Anonymous
Most polluted air quality stations
| # | station | US AQI |
|---|---|---|
| 1 | Shamsabad Colony | 68 |
Health Recommendations
| Sensitive groups should reduce outdoor exercise | |
| Close your windows to avoid dirty outdoor air GET A MONITOR | |
| Sensitive groups should wear a mask outdoors GET A MASK | |
| Sensitive groups should run an air purifier GET AN AIR PURIFIER |
Become a contributor
Get an AirVisual Outdoor and contribute to collecting millions of data points for the Multan map to track local air pollution
Understand air pollution and protect yourself
Multan MAP AIR QUALITY ANALYSIS AND STATISTICS
Will high air quality map cause health issues in Multan?
When air quality readings are high on the air pollution map for Multan, several unpleasant side effects and health issues may start to appear amongst the population. Furthermore, those who already have pre-existing health conditions may see them start to worsen, with simple respiratory conditions progressing into potentially life-threatening conditions.
These can include ones such as emphysema, pneumonia, bronchitis and asthma. Whilst there is not a guaranteed correlation between the two, it is also very likely that staying within an area on the air quality map that has excessively high air pollution readings in the form of US AQI will cause some form of distress to those within the vicinity.
Can people prevent health issues by using air quality maps in Multan?
while a majority of the population within Multan can benefit from observing the air quality map, or air pollution map pages, as well as the city map pages that show the pollution level as an average throughout the city (as well as giving forecasts and concentration levels of certain pollutants), there are those who due to some reasons, may need to monitor both their health and the air cleanliness levels more closely. For those that are more prominently affected, preventative measures may need to be put into action to stay as safe as possible from breathing any potentially harmful pollutants, looking at both chemical compounds in the forms of gases as well as ultrafine particles that can permeate the air, causing health issues as well as aggravating pre-existing ones amongst inhabitants of Multan.
To go into more detail as to who would benefit from utilizing air quality maps and staying up to date with pollution forecasts (although it can be noted that Multan generally maintains an appreciable level of air quality throughout much of the year, although as with all cities worldwide, it can be subject to sudden jumps in its pollution levels due to many reasons), they would fall into certain categories or demographics within the population of Multan. They include people such as the elderly, who are particularly vulnerable to ailments that affect the respiratory tract, on occasion seeing simple or mild infections of the throat or chest turn into ones that lead to more severe complications.
Air quality maps can allow elderly citizens within Multan to be able to spot areas of higher pollution concentrations, and thus avoid them, significantly reducing the amount of haze, chemicals or clouds of ultrafine particles that one might come into in such areas. Once again, the pollution levels shown on the air quality maps in Multan are generally very good, but can still be useful during times of excess pollution due to a lack of strong winds or rain in certain areas allowing pollutants from cars, industrial sites and power plants, along with ultrafine materials coming from construction sites all potentially accumulating under the right circumstances, which is when the air pollution maps can be of great use. Others include young children and babies, so as such families who are taking care of younger ones can utilize the air quality maps to avoid any higher areas of the city, which can prevent young children from developing potentially lifelong health issues such as asthma, as well as preventing their aggravation.
Pollen levels can count amongst the ultrafine particles in the air, with pollen splitting into smaller fragments and becoming part of the PM10 or even PM2.5 collective. In closing, others that benefit from the use of air quality maps include those with the aforementioned pre-existing health conditions (particularly of the cardiac or pulmonary variety), those with compromised immune systems, as well as individuals who have a hypersensitive disposition toward certain chemical compounds, gases, or particles. Keeping up with air pollution forecasts on the city pages can allow users to pre-empt when there may be spikes in the US AQI levels, and as such the air quality map itself will show exactly where in Multan these pollution levels are at their highest, so the most vulnerable groups of people can more easily avoid them, along with healthy individuals and those who wish to keep their pollution exposure to a minimum.
What can be done in Multan to reduce air quality map elevations?
Whilst this goes beyond the scope of what the air quality maps in Multan can provide in terms of help for its citizens and others who may use the map whilst traveling through the city, long-term goals such as reducing dependency on fossil fuels, removing defunct or old cars, trucks and motorbikes from the roads, as well as holding factories, power plants and other polluting entities accountable for how much air pollution they put out. Over time these will help Multan to see better readings on its air quality map.
Are the readings on the air quality maps high in Multan?
As with many cities and countries throughout the region, Multan can see higher rates of air pollution showing up on its air quality maps from several different sources. Whilst there are a variety of polluting sources, they largely remain the same across each city, with the same offending causes cropping up time and time again. The use of the air quality map for those living or even traveling to Multan can be of great help in keeping their exposure levels to a minimum, as well as helping users to make informed decisions regarding what actions to take during days of higher air pollution levels. As with many cities across the region, Multan is still seeing growth in its infrastructure as well as increases in tourism, despite the events of 2020 putting a large halt to tourist movement due to lockdowns imposed by Covid-19. With increased growth comes further construction sites, which can give off large amounts of air pollution in the form of both hazardous particulate matter as well as many different gases that are released as a byproduct from construction processes as well as given off by many heavy-duty machines used on construction sites.
This is also not to mention the large amount of vehicular movement that would be required to transport material from one location to the next, which is also a large part of all industries which require mass transits. Vehicles and construction sites therefore can all give off larger amounts of pollution and contaminating particles, all of which will show up on the air pollution maps as seen above.
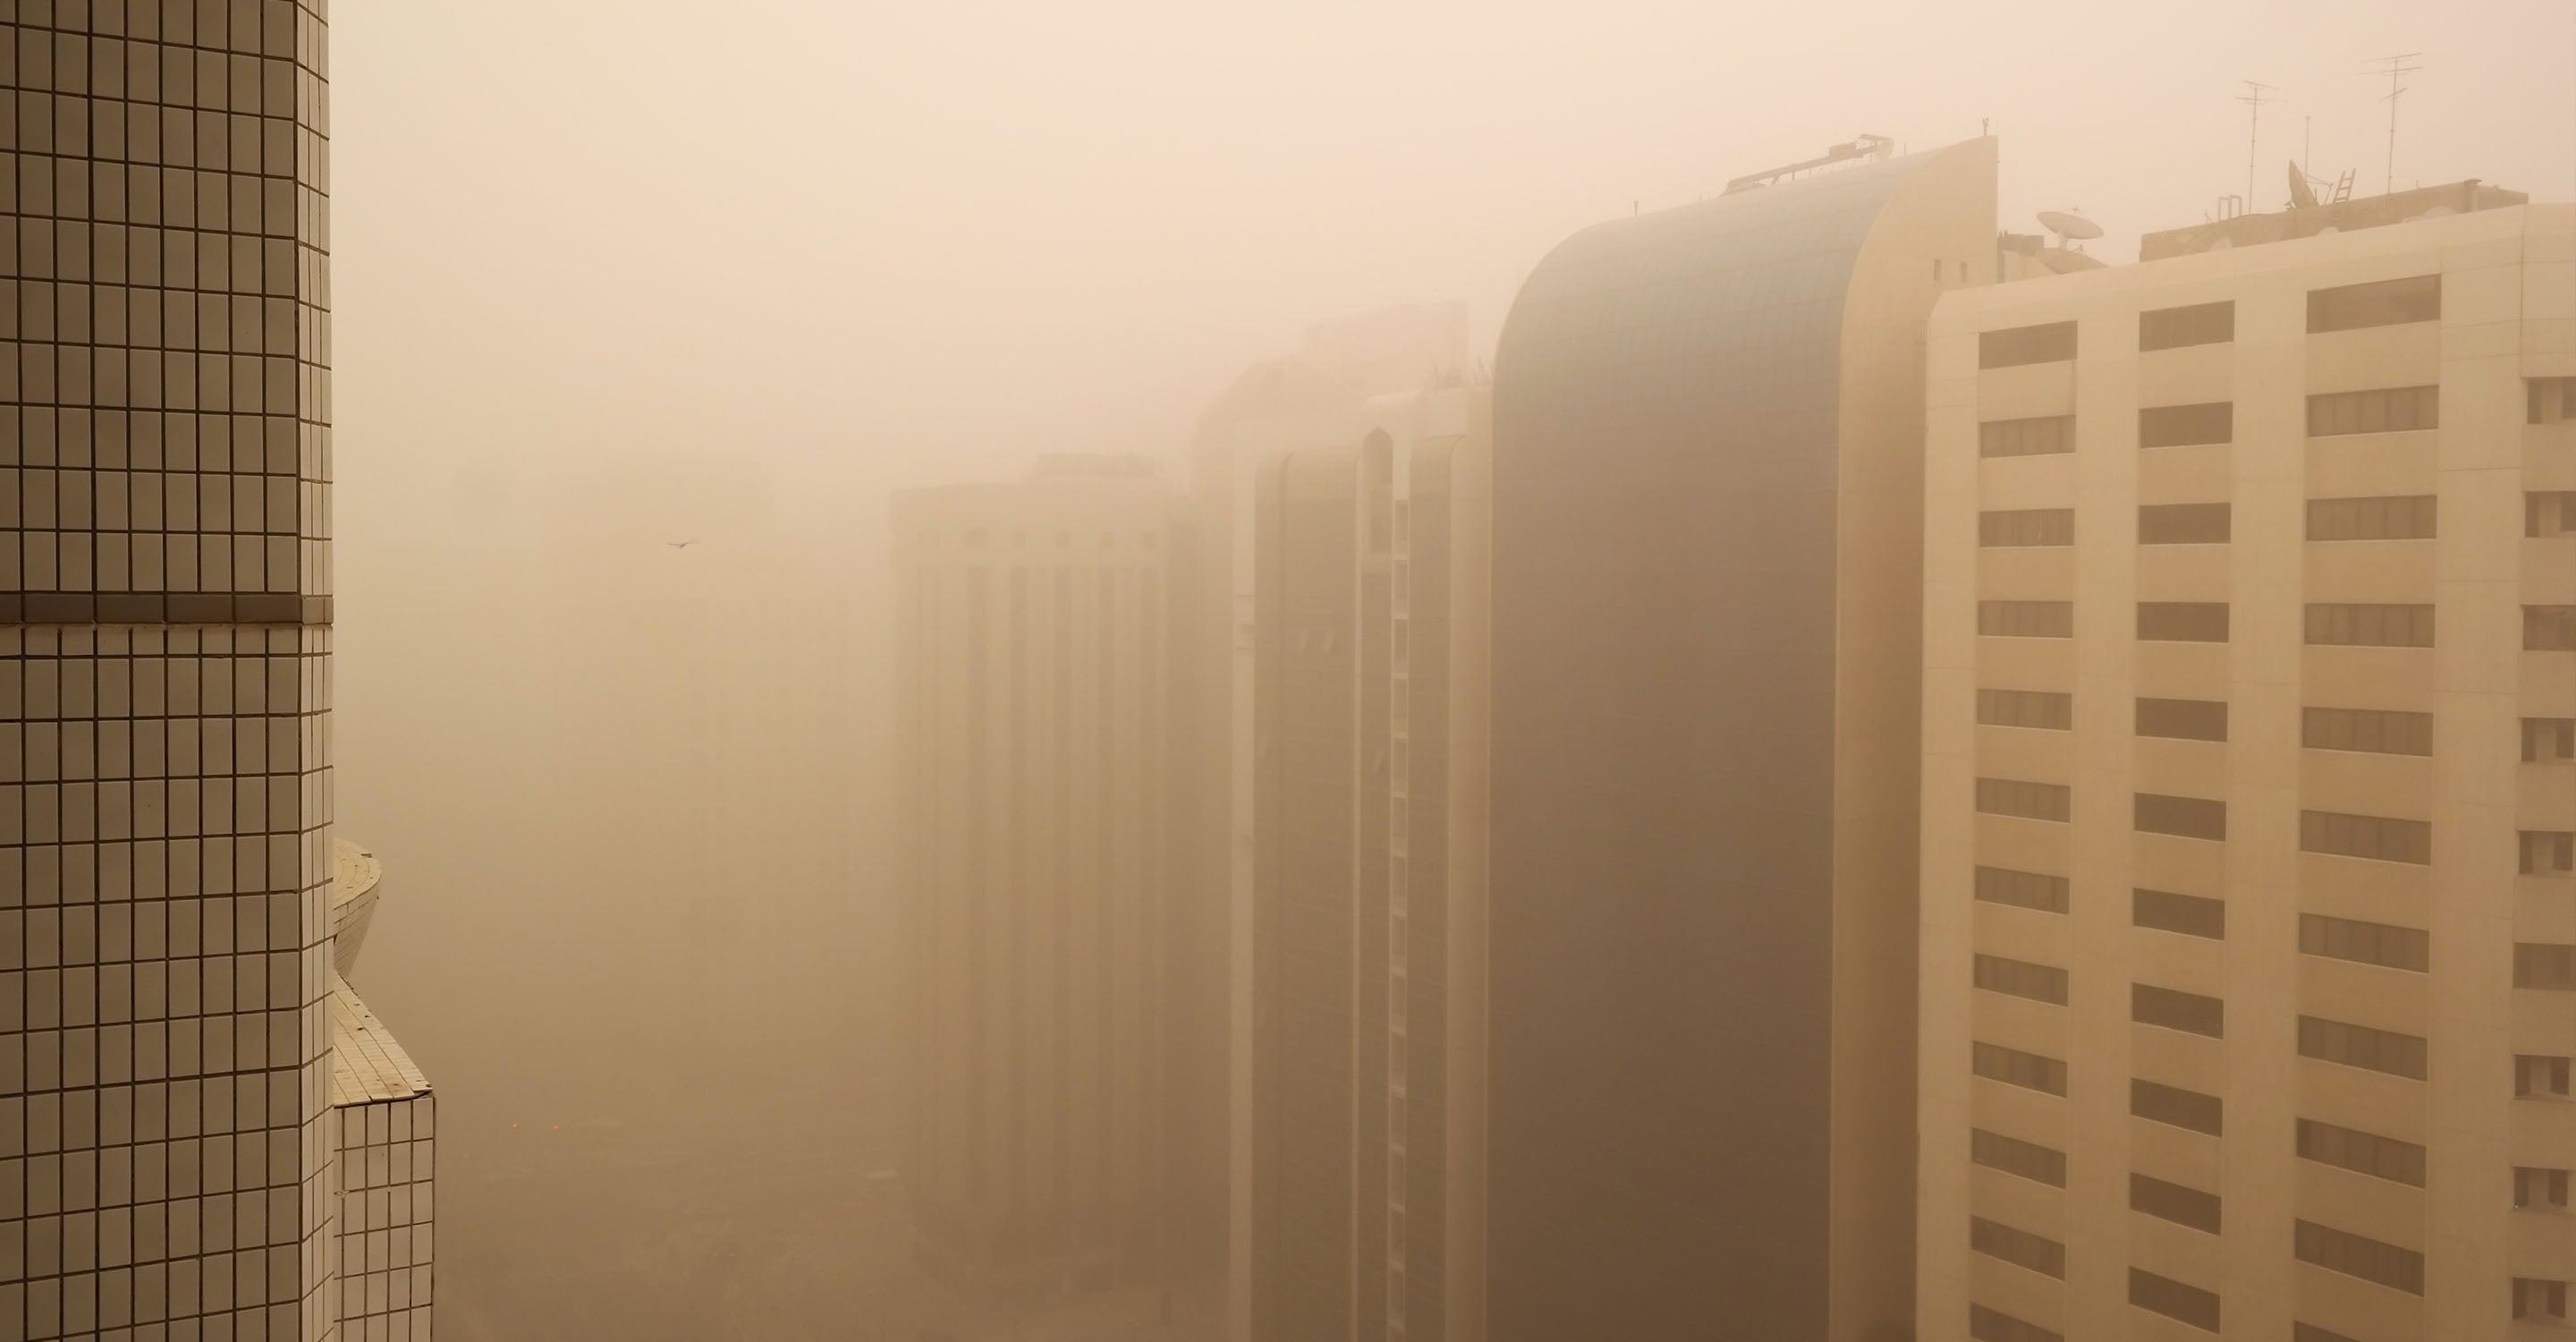
To compound the particle pollution situation further, it should be noted that due to the arid conditions and large amounts of sand and finely ground materials surrounding Multan, there will naturally be higher amounts of microscopic particles in the air, particularly during bouts of higher wind speed, whereby larger amounts of sand may be blown into certain parts of the city where it can accumulate. Whilst these particles are larger and less damaging to the lungs and other parts of the body such as the skin or eyes, they may still cause respiratory irritation. The air quality maps shown above can alert users as to when US AQI levels are higher in many areas across Multan.
Other prominent causes of air pollution in Multan include, as was previously mentioned, the myriad of chemical compounds, gases and fine particles that are given off from vehicle usage, along with heavy machinery, construction sites, and any other areas that have a form of fuel combustion taking place. Other causes of higher air pollution readings on the map for Multan can be caused on occasion by meteorological events, coupled with other factors coming together to form higher readings.
Certain pollutants and gases that are given off by vehicles and other combustion sources can turn into dangerous forms of pollution such as ozone, or smog as it is commonly referred to. High concentrations of sunlight can force a chemical reaction to take place, and with large buildings in city centers preventing these buildups from being blown away (depending on weather conditions), certain pollutants may build up to even higher levels, causing the air quality map to show higher US AQI readings.
Multan air quality data attribution
1Contributor
- Huzaifa Qasmi
1 station
Individual Contributor
1 Data source


