Hull air quality map
Live air pollution map of Hull
1.1K people follow this city
Full screen
Contributors
3
Stations
2
Contributors category
3
Government
0
Non-profit organization
0
Educational
0
Corporate
0
Individual
0
Anonymous
Most polluted air quality stations
| # | station | US AQI |
|---|---|---|
| 1 | Hull Freetown | 31 |
| 2 | Hull Holderness Road | 25 |
community highlight
Hull most followed contributors
Health Recommendations
| Enjoy outdoor activities | |
| Open your windows to bring clean, fresh air indoors GET A MONITOR |
Become a contributor
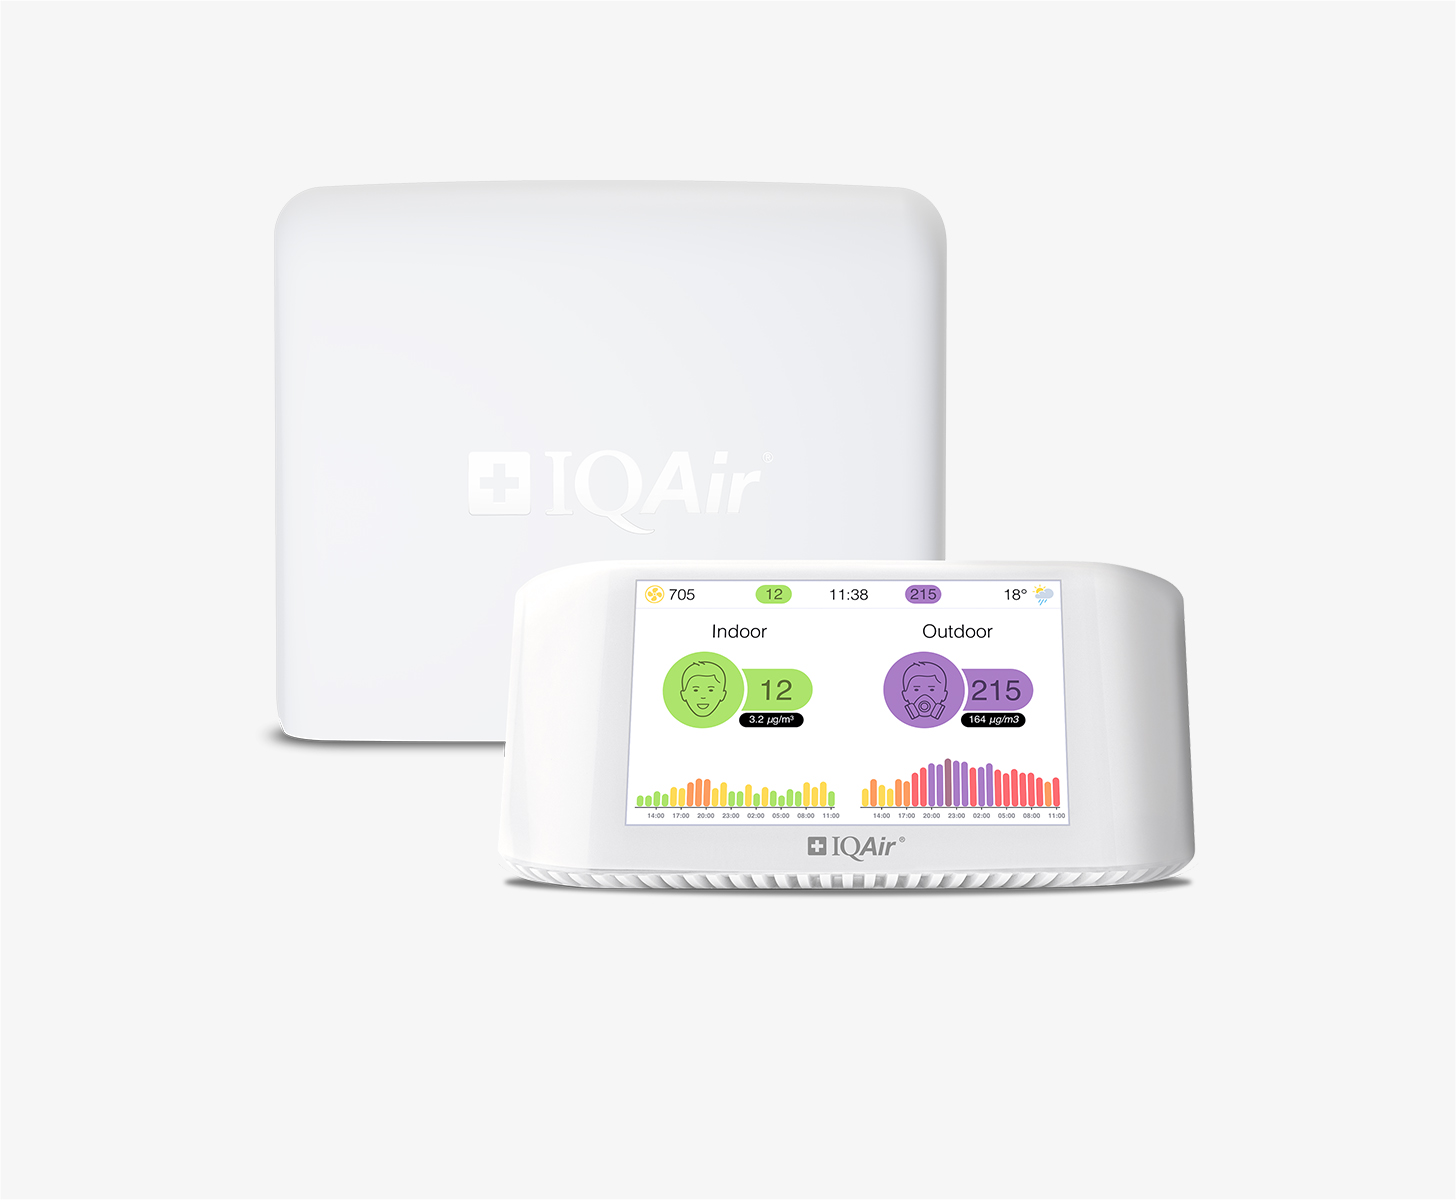
Get an AirVisual Outdoor and contribute to collecting millions of data points for the Hull map to track local air pollution
Understand air pollution and protect yourself
Hull MAP AIR QUALITY ANALYSIS AND STATISTICS
What exciting information about air quality can be seen on the air pollution map for Hull?
There is a lot of stimulating information on the air pollution map for Hull, and access is gained to it from the main city page. By selecting the map icon at the top of the page, a new page will open which contains all the relevant information about the current air quality in Hull.
When the map page first opens, the viewer cannot help but notice the strong colouration of the page. This use of colour shows the current air quality in a very visual way. Colours can range from pale green to dark maroon where the darker the colour, the worse the air quality. These colours are standard across the whole IQAir website. There are also some coloured discs scattered across the map. These mark the positions of the ground-level air monitoring stations. Each station can be explored further by selecting the disc and a new page will open filled with information about that area of the city.
The number they each display at their centre is the United States Air Quality Index reading or US AQI for short. This is calculated by taking measurements of six of the most commonly found pollutants in the city air. They are usually both sizes of Particulate Matter (PM2.5 and PM10), nitrogen dioxide, sulphur dioxide, carbon monoxide and ozone. Once the reading is established it can be used as a metric when comparing air quality in different cities across the globe. The system is wholly endorsed by the World Health Organisation (WHO).
Briefly looking back at the main city page, it is revealed in the coloured banner at the top pf the page that during December 2022, Hull was experiencing a period of air quality that was classified as being “Unhealthy for sensitive groups” with a US AQI reading of 117. Three of the main pollutants were measured but it was PM2.5 whose level was 42 µg/m³ that is used as the benchmark. With a level such as this, it is almost eight and a half times higher than the target figure of 5 µg/m³, as suggested by the WHO.
Directly below the air pollution map for Hull can be seen the number of contributors there are and the number of stations they operate. Currently, there are four government-controlled contributors supervising two stations.
Is there any more interesting information about air quality on the air pollution map for Hull?
There is much more information about air quality on the air pollution map for Hull but in order to see all of it, the page needs to be viewed in full-screen mode. This is very easy to do by choosing the icon at the top of the page which will expand it to full size.
Once viewed in this way, a list of four options will appear on the left-hand side of the screen. These can all be toggled on and off to get a better idea of the effect each one has.
The first option reveals the location of the ground-level air monitoring stations which can each be further explored by selecting a particular disc. The second option shows if any wildfires are burning in the vicinity. In December 2022, there were no such icons to see on the map. If there were then option four needs to be consulted because this option shows the speed and direction of the prevailing winds and will give a good indication of where the smoke might blow.
This just leaves option three which shows the current air quality by colouring the background of the map to reflect this. This colouration may be too intense for some viewers, in which case, it can be deactivated and the map will revert to a standard set of colours which might be easier to understand.
There is more information on the right-hand side of the screen where a table will be seen. This table shows the ranking of the world cities according to their levels of air cleanliness. By default, only seven are shown, but the page can be explored further by checking out the full ranking where all participating cities are shown.
Is the source of the polluted air shown on the air pollution map for Hull?
Whilst the source of polluted air is not shown directly on the air pollution map for Hull, it is known that the main pollutant is nitrogen dioxide whose main source is the incomplete combustion of diesel in vehicles. The highest pollution concentrations are near the train and bus stations, the industrial areas and around the docks. Other sources include construction activities, factories, stubble burning and fossil fuels and wildfires, etc.
Ozone is a pollutant gas which is not emitted directly from any source, but is produced by reactions between other pollutants in the presence of sunlight. (This is what is known as a ‘secondary pollutant’.) Ozone concentrations are greatest in the summer. It can travel long distances and reach high concentrations far away from the original source. It is an irritant to the airways of the lungs, throat and eyes: it can also harm vegetation.
PM2.5 is often mentioned on the air pollution map for Hull, but what is it?
Fine particles are, according to the World Health Organisation, the biggest air pollution problem in relation to human health. They can cause cardiovascular disease, lung disease and cancer. Particles can be derived directly from wood-burning stoves and diesel cars (primary particles) or are formed from different types of air via a number of processes in the atmosphere (secondary particles). Particles come in different sizes, shapes and chemical compositions, which affect how harmful the particles are. It has been shown that particularly fine particles with a diameter of 2.5 μm or less (PM2.5) pose the greatest health risk.
PM is a common proxy indicator for air pollution. It affects more people than any other pollutant. The major components of PM are sulphate, nitrates, ammonia, sodium chloride, black carbon, mineral dust and water. It consists of a complex mixture of solid and liquid particles of organic and inorganic substances suspended in the air. While particles with a diameter of 10 microns or less, can penetrate and lodge deep inside the lungs, the even more health-damaging particles are those with a diameter of 2.5 microns or less. PM2.5 can penetrate the lung barrier and enter the blood system. Chronic exposure to particles contributes to the risk of developing cardiovascular and respiratory diseases, as well as lung cancer.
Hull air quality data attribution
3Contributors
 UK Air Quality
2 stations
 North Lincs Air Quality
2 stations
3 Government Contributors


