
Pollen count and allergy info for Cleveland
Cleveland pollen and allergy report • 06:00, Jul 24 Local time
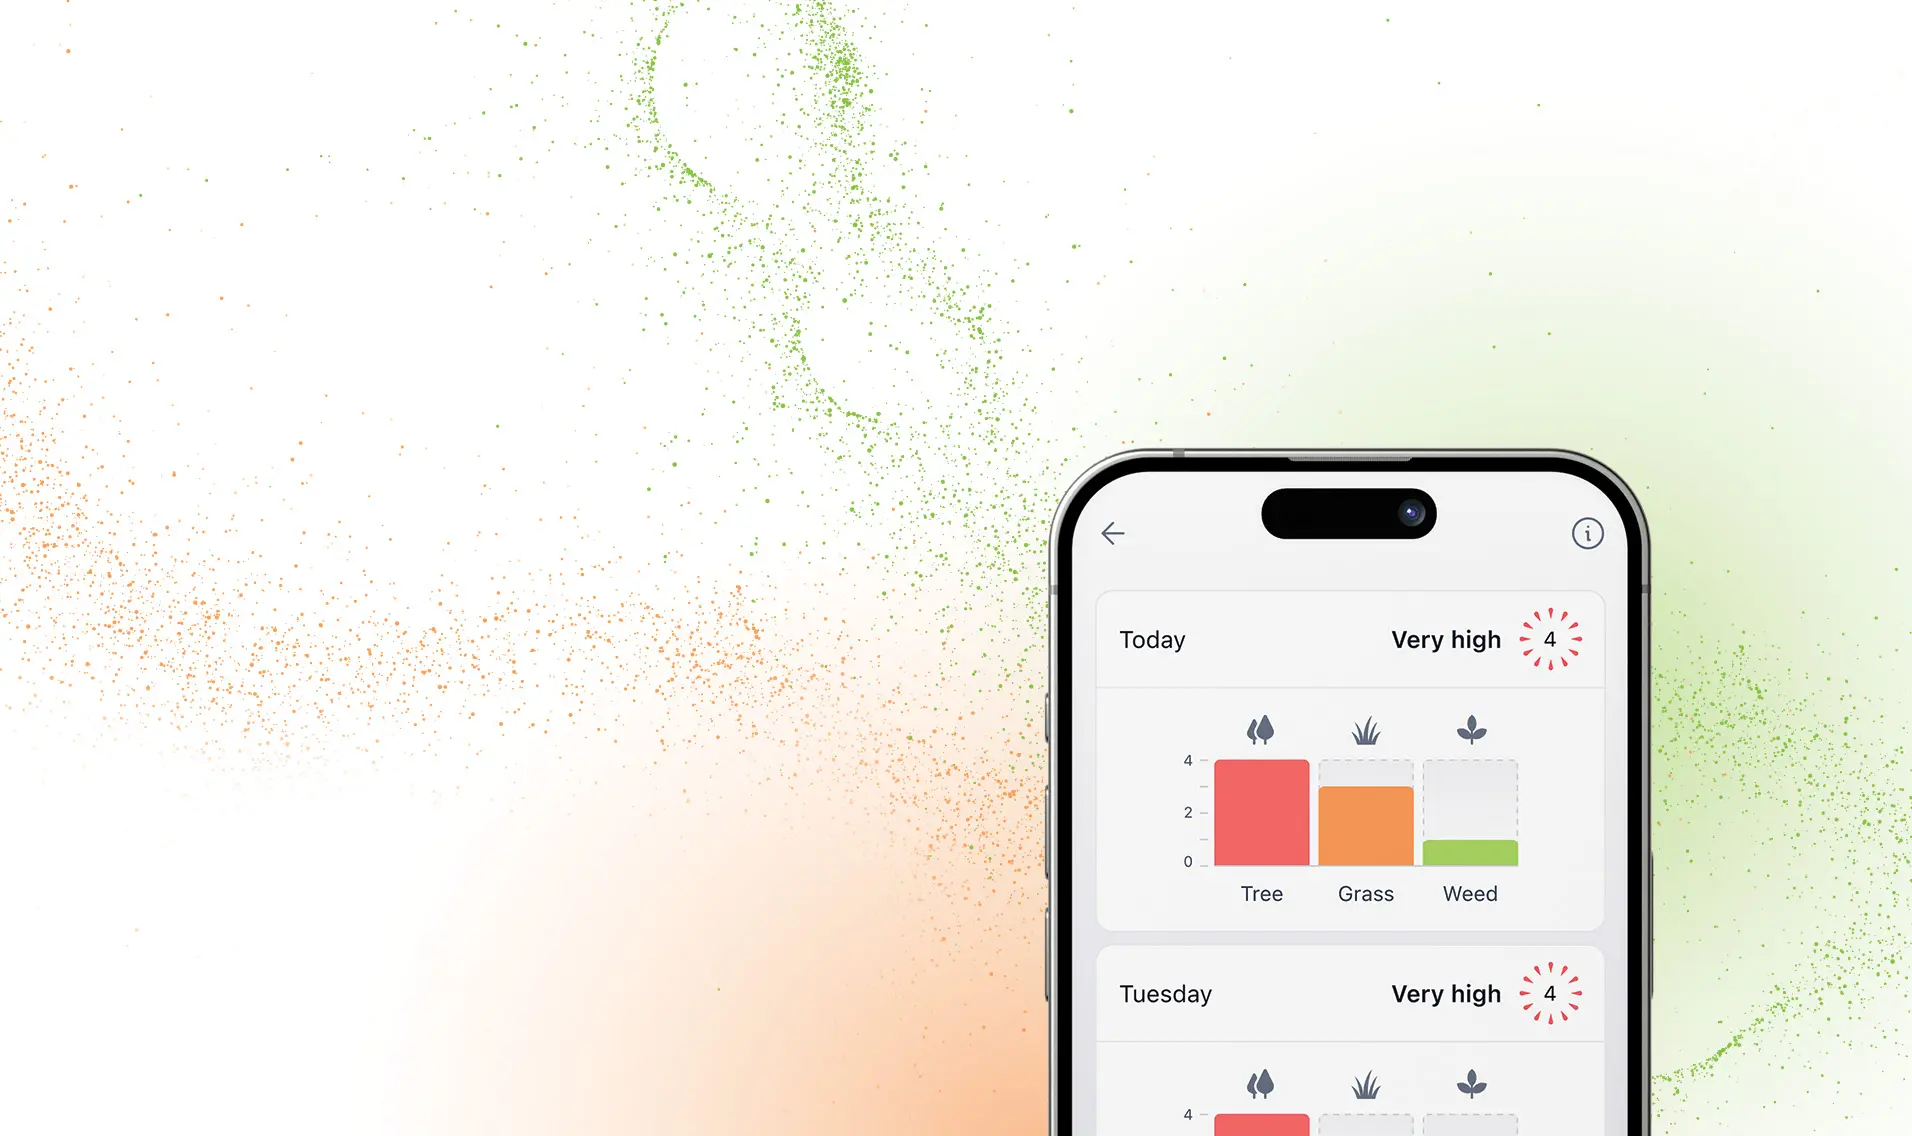
Index

High
Tree
None
Grass
Moderate
Weed
High
Daily allergy forecast
Cleveland pollen count forecast
Today  12 km/h 25°17°  54% | Saturday 15 km/h24°21° 72% | Sunday 17 km/h29°19° 76% |
Air pollutants
Air quality in Cleveland today
Learn more about pollen in Cleveland


Protect yourself from air pollution in Cleveland

Monitor the air you breathe
Get accurate AirVisual air quality readings and real-time insights for cleaner air. Monitors that reveal pollution sources, highlight when air purifier use is needed.

Medical grade air purifiers
Trusted worldwide, the HealthPro Series uses HyperHEPA technology. Filters ultrafine particles other air purifiers miss, delivering medical-grade protection.

Powerful, stylish air purifiers
Compact and powerful, the Atem Series combines Swiss engineering with high-performance air purification, filtering ultrafine particles with HyperHEPA technology.
Download our Air Quality App
How is the pollen count measured in Cleveland?
Pollen count in Cleveland involves a systematic process that makes use of various monitoring tools and methods. One of the primary devices used for this purpose is the pollen trap. These traps are not exclusive to Cleveland and are standard equipment used worldwide for monitoring and studying pollen levels in the atmosphere.
Pollen traps are set up in multiple strategic locations across Cleveland. The idea behind selecting these locations is to provide a comprehensive overview of the pollen distribution across different parts of the city. Both urban and suburban areas are considered when setting up these traps. The variety in locations ensures that data from densely populated areas and areas with rich vegetation are both accounted for.
Once the pollen trap is in place, it operates by drawing in air. As the air moves through the trap, the pollen particles present in the air are collected on a sticky surface or medium. This process is continuous, with the trap operating around the clock. By doing this, it ensures that the data collected represents the entire day rather than just a specific period.
After the collection period, which often spans 24 hours, the samples are then removed from the trap and prepared for examination. This involves placing them under a microscope for a detailed view. Under the microscope, the individual pollen grains become visible, allowing scientists to distinguish between different types of pollen based on their shape, size, and other unique characteristics.
The identification process is crucial. By identifying the types of pollen, scientists can determine which plants are currently producing pollen and in what quantities. For example, during the spring, tree pollen might be dominant, while in the summer, grass pollen might take precedence. The meticulous identification helps in mapping out pollen trends across different seasons.
After the identification process, the next step is quantification. Here, experts determine the exact number of pollen grains present in the sample. By doing this, they can extrapolate and calculate the number of pollen grains present in a cubic metre of air over the 24-hour period.
The resulting data is then made available to the public, often through various platforms such as weather forecasting websites, health advisories, and even dedicated pollen count tracking platforms. This information becomes especially crucial for individuals who suffer from pollen allergies as it helps them prepare and take necessary precautions.
It's essential to highlight that while the data is comprehensive, it provides a snapshot of pollen levels at that specific time and place. Factors such as weather changes, wind direction, and plant life cycles can cause fluctuations in pollen counts. Therefore, regular monitoring and updates are critical to provide the most accurate and current information to the residents of Cleveland.
Is there a particular time of day when the pollen count is highest in Cleveland?
Cleveland, much like various other parts of the world, observes fluctuating pollen levels based on the time of day. The rhythm with which plants release pollen has evolved over time, influenced by the goal to maximise their reproductive success.
Trees are among the primary producers of airborne pollen. In Cleveland, trees tend to release their pollen during the early hours of the morning. This time window, specifically between 5 am and 10 am, witnesses a spike in tree pollen count. The rationale behind this timing is rooted in environmental conditions. Early mornings are typically cooler, and the air is more still. These conditions are conducive for pollen grains to settle on nearby receptive plants, rather than being carried away by strong winds.
Contrastingly, grasses have a different pollen release strategy. They release pollen later in the day, generally in the late afternoon and into the early evening. The timing of grass pollen release has evolved for reasons that are not entirely similar to trees. For instance, certain insects that assist in the pollination of specific grasses might be more active during these hours. Furthermore, the heat of the afternoon can help elevate the lightweight grass pollen, allowing it to disperse over a broader area.
Yet, the rhythm of pollen release is not the only determinant of pollen count. External environmental factors play a significant role. Among these, wind stands out. Wind carries pollen from its point of origin to other areas. A breezy day, especially one following the primary pollen release timings, can cause pollen counts to surge as the pollen disperses more widely.
Humidity is another crucial factor. High humidity can cause pollen to become damp and heavy, making it less likely to stay airborne. Conversely, on days with low humidity, the dryness allows pollen to remain suspended in the air for longer durations, thus affecting the count.
Temperature also influences pollen counts, albeit indirectly. Warm temperatures can accelerate plant metabolism, potentially causing some species to produce and release more pollen. Conversely, a sudden drop in temperature might hinder pollen release, as plants might become less active.
It's essential to note that while these general patterns exist, there are variations based on specific local conditions, tree and grass species, and other unforeseen factors. For residents of Cleveland or those visiting, staying updated with daily pollen forecasts can provide valuable insights into expected pollen levels and enable them to take preventive measures if needed.
Are there any specific areas in Cleveland with higher pollen counts?
Pollen counts are not uniform throughout Cleveland. Several factors contribute to these variations, and understanding them can help residents and visitors make informed decisions.
Vegetation's Role in Pollen Counts:
Dense vegetation is a primary factor in higher pollen levels. Trees, grasses, and weeds are primary producers of pollen. Areas with a high concentration of certain types of vegetation known for heavy pollen production will naturally have higher counts. For instance, neighbourhoods with a high concentration of oak, pine, or maple trees might experience elevated pollen levels during their blooming seasons.
The Influence of Urban Development:
Cleveland, like many cities, has undergone significant urban development. Urban areas tend to have fewer green spaces, and as a result, these areas might have lower pollen counts than more vegetative or suburban regions. However, this doesn't mean urban areas are pollen-free. Pollen is lightweight and can travel long distances, especially on windy days. Buildings and other infrastructures can sometimes trap or redirect these pollen flows, leading to pockets of high pollen concentration even in highly built-up areas.
Proximity to Water Bodies and its Impact:
Cleveland's proximity to Lake Erie and various rivers means that areas close to these water bodies might experience different pollen dynamics. While water bodies can sometimes help in settling the airborne pollen, the vegetation around them can be a source of pollen. Moreover, breezes from the water can distribute pollen over a broader area, affecting regions that are otherwise less prone to high pollen counts.
Parks, Gardens, and Open Spaces:
Green spaces within the city, such as parks and gardens, are often hotspots for pollen. These areas, being rich in vegetation, can be sources of increased pollen counts. It's not uncommon for people to experience heightened allergy symptoms when visiting these places, especially during peak blooming periods.
The Utility of Localised Pollen Forecasts:
Given the variations in pollen counts across Cleveland, localised pollen forecasts become crucial, especially for those who are sensitive to pollen. These forecasts, often available online or through weather apps, provide day-to-day updates on expected pollen levels. They can also break down the types of pollen prevalent, which is beneficial for those allergic to specific pollen types.
It's essential to be aware of the pollen dynamics in your specific area within Cleveland. Awareness can aid in planning outdoor activities and implementing strategies to reduce pollen exposure.
Does the pollen count in Cleveland impact the overall air quality index?
To understand the relationship between the pollen count in Cleveland and the AQI, it's important first to grasp what each measurement signifies.
The AQI is an index used globally to communicate how polluted the air currently is or how polluted it is forecasted to become. It does this by taking into account five major air pollutants regulated by the Clean Air Act: ozone, particulate matter, carbon monoxide, sulphur dioxide, and nitrogen dioxide. Each of these pollutants has a separate standard, and the AQI value is based on the highest of these individual index values. A higher AQI value means there's a greater level of air pollution, indicating a greater health concern.
Pollen count, on the other hand, refers to the concentration of pollen in the air. Pollen is a fine to coarse powdery substance made up of tiny particles from plants that are used for reproduction. While pollen is a natural substance and not a pollutant in the conventional sense, it can act as an irritant for many people, causing allergic reactions and other respiratory issues.
Pollen isn't included in the AQI because it isn't considered a traditional air pollutant. The AQI is designed to reflect the concentrations of pollutants that are known to harm human health, and the standards set for these pollutants are based on what's known about their effects on health and the environment.
However, the effects of high pollen counts can mimic those of a high AQI. Those with allergies or respiratory conditions may find it hard to breathe, may experience coughing, or may have watery eyes, much like they would on a day when the AQI is high due to pollutants. In fact, for people with pollen allergies, the discomfort from high pollen counts might even be more acute than from traditional pollutants.
Furthermore, there are occasions when high pollen counts and high AQI values can occur simultaneously. Certain seasons, notably spring and early summer when many plants release their pollen, also tend to be times of increased ozone formation. Ozone, a major component of smog, can be formed when pollutants emitted by cars, power plants, and other sources undergo chemical reactions in the presence of sunlight. If there's a lot of plant activity during these times, pollen counts can be high, while at the same time, conditions are right for ozone formation, leading to a high AQI.
In Cleveland, where there's a mix of urban and natural environments, this can be particularly pronounced. The city experiences a range of pollen types across different seasons. But while there might be correlations and overlaps, it's essential to understand that pollen counts and AQI values are distinct measures. They are both important in their own right and serve to inform the public about different potential irritants in the air. They are measured, reported, and understood separately, each providing critical information for the well-being of the residents.
Is the pollen count in Cleveland higher during specific seasons?
The variation in pollen counts across seasons in Cleveland can be attributed to different plants producing pollen at different times of the year. This pattern, which affects many regions, means that pollen counts can be predicted to a certain degree based on the season.
In spring, the primary source of pollen is trees. Among the trees, oak, elm, maple, and pine are particularly active in pollen production. As they release pollen, the atmosphere becomes dense with these particles, leading to an increase in pollen counts. This can be especially noticeable in areas with a high concentration of these trees. Residents and visitors during the spring season often find that the early months of the year are when tree pollen is at its peak.
Summer shifts the focus from tree pollen to grass pollen. During this season, grasses such as Bermuda, Timothy, Kentucky bluegrass, and ryegrass begin to release their pollen. The proliferation of these grasses in the region means that pollen counts can rise significantly. Just like with tree pollen in spring, the abundance of these grasses in an area will have a direct impact on how high the pollen counts get.
Late summer and early autumn introduce another type of pollen: that from weeds. This transition indicates that as summer winds down, certain weeds start to release their pollen. Notable among these are ragweed, sagebrush, and lamb's quarters. For those sensitive to these particular pollens, this period can be challenging, as these plants are widespread and can cause pollen counts to spike.
Winter, in contrast to the other seasons, is marked by a decrease in pollen counts. The main reason for this is that many plants enter a dormant phase during the colder months. The drop in temperature and the decrease in daylight hours signal to most plants that it's time to conserve energy and halt growth and reproduction, which includes the release of pollen.
Given these seasonal shifts in pollen sources, those who are affected by pollen – either due to allergies or other concerns – might find it helpful to keep track of local pollen forecasts. These forecasts, provided by meteorological and environmental agencies, offer insights into expected pollen counts based on current and projected weather conditions. By monitoring these forecasts, people can get a sense of what to expect and can take measures to mitigate exposure.
Where is the highest pollen level in Ohio?
- Ada3
- Akron3
- Allen County3
- Alliance3
- Amberley3
- Amelia3
- Amherst3
- Andover3
- Anna3
- Ansonia3
- Antwerp3
- Apple Creek3
- Apple Valley3
- Arcanum3
- Archbold3
- Arlington3
- Arlington Heights3
- Ashland3
- Ashley3
- Ashtabula3
- Ashville3
- Auglaize County3
- Aurora3
- Austintown3
- Avon3
- Avon Lake3
- Bainbridge, Geauga County3
- Ballville3
- Baltic3
- Baltimore3
- Barberton3
- Barnesville3
- Bay Village3
- Beach City3
- Beachwood3
- Beavercreek3
- Beckett Ridge3
- Bedford3
- Bedford Heights3
- Beechwood Trails3
- Bellaire3
- Bellbrook3
- Bellefontaine3
- Bellevue3
- Bellville3
- Belmont County3
- Berea3
- Bethel3
- Bethesda3
- Beverly3
- Bexley3
- Blacklick Estates3
- Blanchester3
- Bloomingdale3
- Blue Ash3
- Bluffton3
- Bolindale3
- Boston Heights3
- Botkins3
- Bowling Green3
- Bradner3
- Bratenahl3
- Brecksville3
- Bremen3
- Brewster3
- Bridgeport3
- Brilliant3
- Brimfield3
- Broadview Heights3
- Brook Park3
- Brookfield Center3
- Brooklyn3
- Brooklyn Heights3
- Brookville3
- Brunswick3
- Bryan3
- Buckeye Lake3
- Bucyrus3
- Burton3
- Butler County3
- Byesville3
- Cadiz3
- Calcutta3
- Cambridge3
- Camden3
- Campbell3
- Canal Fulton3
- Canal Winchester3
- Canfield3
- Canton3
- Cardington3
- Carey3
- Carlisle3
- Carrollton3
- Casstown3
- Cedarville3
- Celina3
- Centerburg3
- Centerville3
- Chagrin Falls3
- Champion Heights3
- Chardon3
- Chauncey3
- Cherry Grove3
- Chesterland3
- Choctaw Lake3
- Churchill3
- Cincinnati3
- Circleville3
- Clark County3
- Clayton3
- Cleveland3
- Cleveland Heights3
- Cleves3
- Clinton3
- Clinton County3
- Clyde3
- Coldwater3
- Columbiana3
- Columbus3
- Columbus Grove3
- Commercial Point3
- Conneaut3
- Continental3
- Convoy3
- Cortland3
- Coshocton3
- Covedale3
- Craig Beach3
- Crawford County3
- Crestline3
- Creston3
- Cridersville3
- Crooksville3
- Crystal Lakes3
- Curtice3
- Cuyahoga3
- Cuyahoga Falls3
- Cuyahoga Heights3
- Dalton3
- Danville3
- Day Heights3
- Dayton3
- De Graff3
- Deer Park3
- Defiance3
- Delaware3
- Delaware County3
- Delhi Hills3
- Delphos3
- Delta3
- Dennison3
- Dent3
- Deshler3
- Dillonvale, Hamilton County3
- Dover3
- Doylestown3
- Dresden3
- Drexel3
- Dry Ridge3
- Dry Run3
- Dublin3
- Dunlap3
- East Canton3
- East Cleveland3
- East Liverpool3
- East Palestine3
- Eastlake3
- Eaton3
- Eaton Estates3
- Edgerton3
- Edgewood3
- Elida3
- Elmore3
- Elmwood Place3
- Elyria3
- Englewood3
- Enon3
- Etna3
- Euclid3
- Evendale3
- Fairborn3
- Fairfax3
- Fairfield3
- Fairfield Beach3
- Fairlawn3
- Fairport Harbor3
- Fairview Park3
- Farmersville3
- Fayette3
- Findlay3
- Finneytown3
- Five Points3
- Forest3
- Forest Park3
- Forestville3
- Fort Loramie3
- Fort McKinley3
- Fort Recovery3
- Fort Shawnee3
- Fostoria3
- Franklin3
- Franklin County3
- Frazeysburg3
- Fredericktown3
- Fremont3
- Fruit Hill3
- Fulton County3
- Gahanna3
- Galion3
- Gambier3
- Garfield Heights3
- Garrettsville3
- Gates Mills3
- Geauga3
- Geneva3
- Geneva-on-the-Lake3
- Genoa3
- Georgetown3
- Germantown3
- Gettysburg3
- Gibsonburg3
- Girard3
- Glandorf3
- Glendale3
- Glenmoor3
- Glenwillow3
- Glouster3
- Gnadenhutten3
- Golf Manor3
- Goshen3
- Grafton3
- Grandview3
- Grandview Heights3
- Granville3
- Granville South3
- Green3
- Green Meadows3
- Green Springs3
- Greene County3
- Greenfield3
- Greenhills3
- Greentown3
- Greenville3
- Greenwich3
- Grove City3
- Groveport3
- Guernsey County3
- Hamilton3
- Hamilton County3
- Hanover3
- Harbor Hills3
- Hartville3
- Haskins3
- Heath3
- Hebron3
- Hicksville3
- Highland Heights3
- Highpoint3
- Hilliard3
- Hillsboro3
- Hiram3
- Hocking County3
- Holgate3
- Holiday Valley3
- Holland3
- Howland Center3
- Hubbard3
- Huber Heights3
- Huber Ridge3
- Hudson3
- Hunter3
- Huron3
- Independence3
- Jackson3
- Jackson Center3
- Jamestown3
- Jefferson3
- Jeffersonville3
- Johnstown3
- Kalida3
- Kent3
- Kenton3
- Kenwood3
- Kettering3
- Kings Mills3
- Kingston3
- Kinsman Center3
- Kirtland3
- Knox County3
- La Croft3
- LaGrange3
- Lake Darby3
- Lake Lakengren3
- Lake Mohawk3
- Lakemore3
- Lakeview3
- Lakewood3
- Lancaster3
- Landen3
- Lebanon3
- Leesburg3
- Leetonia3
- Leipsic3
- Lewisburg3
- Lexington3
- Liberty Center3
- Licking County3
- Lima3
- Lincoln Heights, Richland County3
- Lincoln Village3
- Linndale3
- Lisbon3
- Lithopolis3
- Lockbourne3
- Lockland3
- Lodi3
- Logan3
- Logan Elm Village3
- London3
- Lorain3
- Loudonville3
- Louisville3
- Loveland3
- Loveland Park3
- Lowellville3
- Lucas County3
- Lucasville3
- Luckey3
- Lynchburg3
- Lyndhurst3
- Macedonia3
- Mack3
- Madeira3
- Madison3
- Madison County3
- Mahoning County3
- Malvern3
- Manchester3
- Mansfield3
- Maple Heights3
- Mariemont3
- Marietta3
- Marion3
- Martins Ferry3
- Marysville3
- Mason3
- Massillon3
- Masury3
- Maumee3
- Mayfield3
- Mayfield Heights3
- McArthur3
- McComb3
- McDonald3
- McKinley Heights3
- Mechanicsburg3
- Medina3
- Medina County3
- Mentor3
- Mentor-on-the-Lake3
- Miami County3
- Miami Heights3
- Miamisburg3
- Miamitown3
- Middleburg Heights3
- Middlefield3
- Middletown3
- Milan3
- Milford3
- Milford Center3
- Millbury3
- Millersburg3
- Millersport3
- Mineral Ridge3
- Minerva3
- Minerva Park3
- Mingo Junction3
- Minster3
- Mogadore3
- Monroeville3
- Montgomery3
- Montpelier3
- Montrose-Ghent3
- Moraine3
- Moreland Hills3
- Morgan County3
- Morgandale3
- Morrow3
- Mount Carmel3
- Mount Gilead3
- Mount Healthy3
- Mount Healthy Heights3
- Mount Repose3
- Mount Sterling3
- Mount Vernon3
- Mulberry3
- Munroe Falls3
- Napoleon3
- Navarre3
- Nelsonville3
- New Albany3
- New Bremen3
- New Burlington3
- New California3
- New Carlisle3
- New Concord3
- New Franklin3
- New Lebanon3
- New Lexington3
- New Matamoras3
- New Miami3
- New Middletown3
- New Paris3
- New Philadelphia3
- New Richmond3
- New Vienna3
- New Waterford3
- Newark3
- Newburgh Heights3
- Newcomerstown3
- Newton Falls3
- Newtown3
- Niles3
- Noble County3
- North Baltimore3
- North Canton3
- North Kingsville3
- North Lewisburg3
- North Madison3
- North Olmsted3
- North Randall3
- North Ridgeville3
- North Royalton3
- North Zanesville3
- Northfield3
- Northgate3
- Northridge3
- Northwood3
- Norton3
- Norwalk3
- Norwood3
- Oak Harbor3
- Oakwood, Montgomery County3
- Oberlin3
- Obetz3
- Olmsted Falls3
- Ontario3
- Orange3
- Oregon3
- Orrville3
- Orwell3
- Ottawa3
- Ottawa County3
- Ottawa Hills3
- Oxford3
- Painesville3
- Pandora3
- Park Layne3
- Parma3
- Parma Heights3
- Pataskala3
- Paulding3
- Payne3
- Peebles3
- Pemberville3
- Pepper Pike3
- Perry3
- Perry Heights3
- Perrysburg3
- Pickerington3
- Pigeon Creek3
- Piketon3
- Pioneer3
- Piqua3
- Plain City3
- Pleasant Grove3
- Pleasant Run3
- Pleasant Run Farm3
- Plymouth3
- Poland3
- Port Clinton3
- Portage County3
- Portage Lakes3
- Powell3
- Powhatan Point3
- Preble County3
- Prospect3
- Put-in-Bay3
- Quaker City3
- Ravenna3
- Reading3
- Reminderville3
- Reno3
- Reynoldsburg3
- Richfield3
- Richmond Heights3
- Richville3
- Richwood3
- Rittman3
- Riverside3
- Roaming Shores3
- Rockford3
- Rocky River3
- Roseville3
- Rossford3
- Rossmoyne3
- Russells Point3
- Sabina3
- Salem3
- Salem Heights, Hamilton County3
- Salineville3
- Sandusky3
- Sawyerwood3
- Saybrook-on-the-Lake3
- Sebring3
- Seven Hills3
- Seville3
- Shadyside3
- Shaker Heights3
- Sharon Center3
- Sharonville3
- Shawnee Hills, Greene County3
- Sheffield3
- Sheffield Lake3
- Shelby3
- Sherwood, Hamilton County3
- Shiloh, Montgomery County3
- Shreve3
- Sidney3
- Silver Lake3
- Silverton3
- Sixteen Mile Stand3
- Smithville3
- Solon3
- Somerset3
- South Amherst3
- South Bloomfield3
- South Canal3
- South Charleston3
- South Euclid3
- South Lebanon3
- South Russell3
- Sparta3
- Spencerville3
- Spring Valley3
- Springboro3
- Springdale3
- Springfield3
- St. Bernard3
- St. Clairsville3
- St. Henry3
- St. Marys3
- St. Paris3
- Steubenville3
- Stony Prairie3
- Stow3
- Strasburg3
- Streetsboro3
- Strongsville3
- Struthers3
- Stryker3
- Sugarcreek3
- Summerside3
- Summit3
- Sunbury3
- Swanton3
- Sylvania3
- Tallmadge3
- Taylor Creek3
- Terrace Park3
- The Plains3
- The Village of Indian Hill3
- Thornport3
- Tiffin3
- Tiltonsville3
- Tipp City3
- Toledo3
- Toronto3
- Trenton3
- Trotwood3
- Troy3
- Trumbull3
- Turpin Hills3
- Tuscarawas3
- Twinsburg3
- Uhrichsville3
- Union3
- Union City3
- Union County3
- Uniontown3
- University Heights3
- Upper Arlington3
- Upper Sandusky3
- Urbana3
- Urbancrest3
- Utica3
- Valley View3
- Valleyview3
- Van Wert3
- Vandalia3
- Vermilion3
- Versailles3
- Wadsworth3
- Wakeman3
- Walbridge3
- Walton Hills3
- Wapakoneta3
- Warren3
- Warren County3
- Warrensville Heights3
- Washington Court House3
- Waterville3
- Wauseon3
- Waverly3
- Waynesville3
- Wellington3
- Wellston3
- Wellsville3
- West Alexandria3
- West Carrollton3
- West Hill3
- West Jefferson3
- West Lafayette3
- West Liberty3
- West Milton3
- West Salem3
- West Unity3
- Westerville3
- Westfield Center3
- Westlake3
- Weston3
- Wharton3
- Whitehall3
- Whitehouse3
- Wickliffe3
- Wilberforce3
- Willard3
- Williamsport3
- Willoughby3
- Willoughby Hills3
- Willowick3
- Wilmington3
- Winchester3
- Windham3
- Wintersville3
- Withamsville3
- Wolfhurst3
- Wood County3
- Woodlawn3
- Woodsfield3
- Woodstock3
- Woodville3
- Wooster3
- Worthington3
- Wright-Patterson AFB3
- Wyoming3
- Xenia3
- Yellow Springs3
- Yorkville3
- Youngstown3
- Zanesville3
- Bradford2
- Caldwell2
- Chillicothe2
- Covington2
- Devola2
- Frankfort2
- Gallipolis2
- Harrison2
- Leavittsburg2
- Lordstown2
- Mantua2
- Massieville2
- McConnelsville2
- Monroe2
- Mount Orab2
- New London2
- Pleasant Hill2
- Ross County2
- South Zanesville2
- West Union2
- Wetherington2
- Williamsburg2
- Aberdeen1
- Athens1
- Athens County1
- Batavia1
- Belpre1
- Bridgetown1
- Burlington1
- Cheviot1
- Coal Grove1
- Franklin Furnace1
- Groesbeck1
- Ironton1
- Lawrence1
- Middleport1
- Monfort Heights1
- New Boston1
- Newport, Washington County1
- North College Hill1
- Northbrook1
- Oak Hill1
- Pomeroy1
- Portsmouth1
- Ripley1
- Rosemount1
- Ross1
- Sciotodale1
- Skyline Acres1
- South Point1
- West Portsmouth1
- Wheelersburg1
- White Oak1


