


 Add
Air quality in Ratchaburi
Air quality index (AQI⁺) and PM2.5 air pollution in Ratchaburi • 334.4K Followers • 09:00, Oct 31 Local time
67
US AQI⁺Moderate

Main pollutant:
PM2.5
17.8 µg/m³

33°

6 km/h

73 %
Hourly forecast
Ratchaburi air quality index (AQI⁺) forecast


Daily forecast
Ratchaburi air quality index (AQI⁺) forecast
| Today | 65 | | 31° 25° |  10 km/h | 84% |
| Sun | 65 | | 32° 24° | 12 km/h | 77% |
| Mon | 61 |  | 33° 24° | 13 km/h | 75% |
Air pollutants
What is the current air quality in Ratchaburi?

PM2.5 concentration is currently 3.6 times the World Health Organization annual PM2.5 guideline value.

Health recommendations
 Sensitive groups should reduce outdoor exercise |
 Close your windows to avoid dirty outdoor air Get a monitor |
 Sensitive groups should wear a mask outdoors Get a mask |
 Sensitive groups should run an air purifier Get an air purifier |
Protect yourself from air pollution in Ratchaburi

Monitor the air you breathe
Get accurate AirVisual air quality readings and real-time insights for cleaner air. Monitors that reveal pollution sources, highlight when air purifier use is needed.
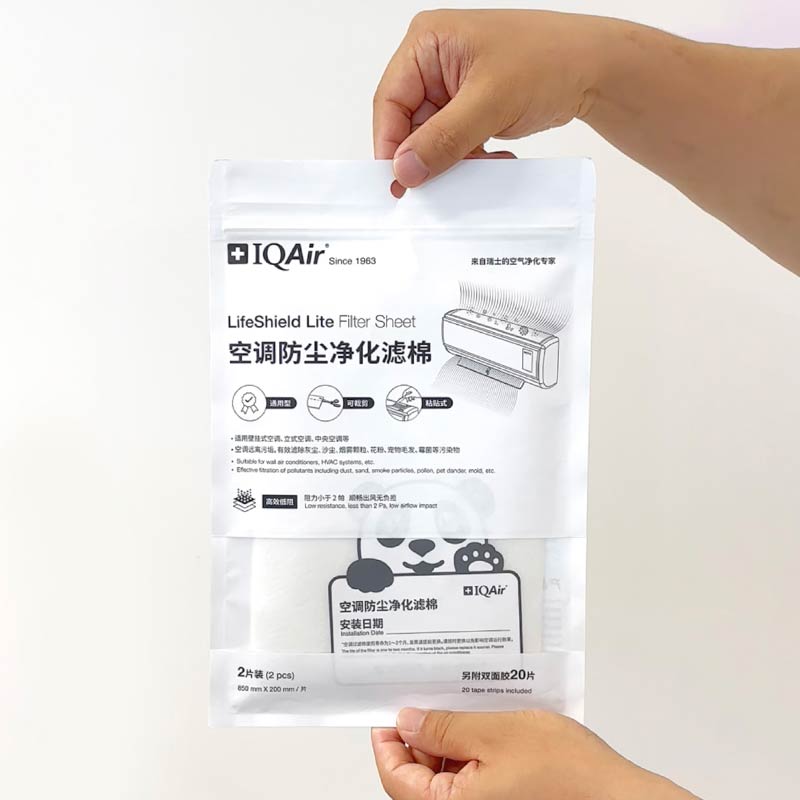
Filtration for air conditioners
A cut-to-fit filtration for air conditioning systems, LifeShield Lite helps reduce dust in the air conditioner while capturing indoor air pollutants.
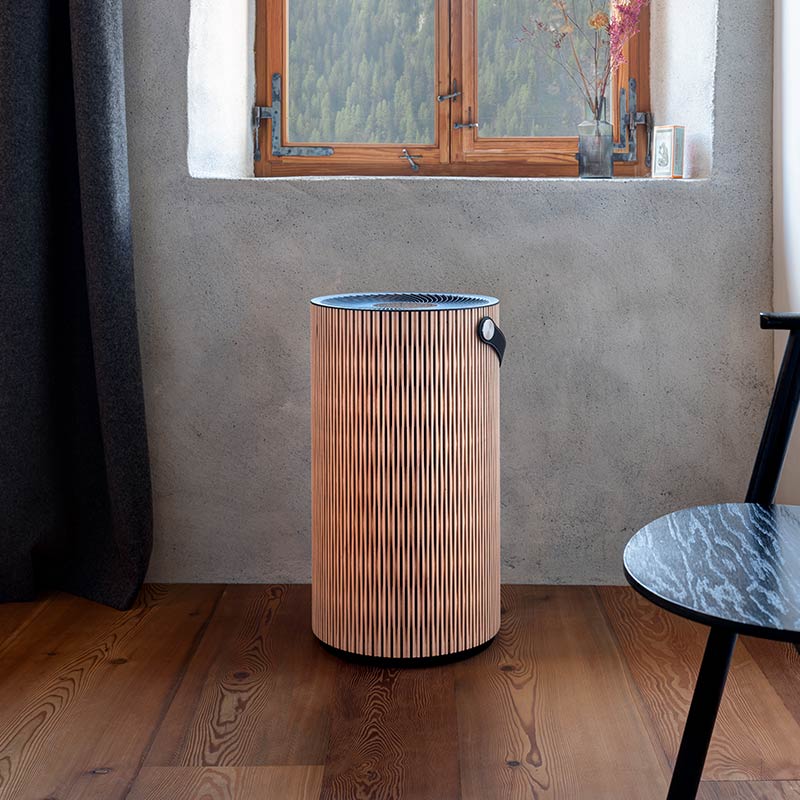
Sustainable, smart air purifiers
Elegantly designed using sustainably sourced beech wood, the Atem Earth delivers medical-grade filtration by capturing ultrafine particles with HyperHEPA technology.
Health recommendations
Sensitive groups should reduce outdoor exercise |
Close your windows to avoid dirty outdoor air Get a monitor |
Sensitive groups should wear a mask outdoors Get a mask |
Sensitive groups should run an air purifier Get an air purifier |
Protect yourself from air pollution in Ratchaburi
Monitor the air you breathe
Get accurate AirVisual air quality readings and real-time insights for cleaner air. Monitors that reveal pollution sources, highlight when air purifier use is needed.
Filtration for air conditioners
A cut-to-fit filtration for air conditioning systems, LifeShield Lite helps reduce dust in the air conditioner while capturing indoor air pollutants.
Sustainable, smart air purifiers
Elegantly designed using sustainably sourced beech wood, the Atem Earth delivers medical-grade filtration by capturing ultrafine particles with HyperHEPA technology.
Most polluted locations near Ratchaburi
Worldwide AQI⁺ ranking
Station ranking
Real-time AQI⁺ station ranking for stations in Ratchaburi
City ranking
Real-time Thailand AQI⁺ city ranking
Historic air quality near Ratchaburi
History
Historic air quality graph for Ratchaburi
Historic air quality near Ratchaburi
History
Historic air quality graph for Ratchaburi
Most polluted locations near Ratchaburi
Worldwide AQI⁺ rankingStation ranking
Real-time AQI⁺ station ranking for stations in Ratchaburi
City ranking
Real-time Thailand AQI⁺ city ranking



Measure your own air quality
Get a monitor and contribute air quality data in your city.
Learn more about global air quality


Learn more about air pollution in Ratchaburi
What is the current air quality in Ratchaburi?
The current air quality in Ratchaburi is considered moderate. Air quality is acceptable for most people, though sensitive individuals may experience mild symptoms such as coughing or shortness of breath.
How polluted is the air in Ratchaburi?
Ratchaburi is a city in the western region of Thailand, being the capital of Ratchaburi province. It has a long history of changing hands through the various kingdoms and empires of the time, but now finds itself as part of the greater Bangkok area, but still a city in its own right. Subsequently, as part of the greater Bangkok area, it would find a large amount of its inhabitants working within Bangkok itself, making the daily commute to the capital city where employment and opportunities are higher.
This kind of anthropogenic (human based) activity can contribute largely to pollution levels, with the high volumes of commuters bringing up the yearly ambient pollution readings via their vehicle usage. As well as this, other factors can affect the pollution levels, with factories, industrial zones and a gradual move towards urbanization bringing up the pollution readings (being a satellite city of Bangkok means there would be an inevitable spread of the capitals infrastructure into its surrounding cities).
Regarding its pollution levels, Ratchaburi came in with a PM2.5 reading of 29.5 μg/m³ over the course of 2019, a reading that put it into the ‘moderate’ ratings bracket, one which requires a PM2.5 reading of anywhere between 12.1 to 35.4 μg/m³ to be classed as such. As is shown, Ratchaburi came in on the somewhat higher end of this moderate bracket, meaning that as a yearly average its pollution levels have the chance to cause a wide array of adverse effects amongst its citizens.
This yearly reading of 29.5 μg/m³ also put Ratchaburi in 451st place out of all cities ranked worldwide, as well as in 22nd place out of all cities ranked in Thailand, coming in way ahead of Bangkok, highlighting that it does indeed have some problems with its pollution levels.
What are the main causes of pollution in Ratchaburi?
As mentioned, being in such close to proximity to the capital city would ultimately have a large impact on the pollution levels of Ratchaburi, even though it managed to come in far ahead of Bangkok in terms of PM2.5 readings as well as its ranking (with Bangkok coming in at 48th place as opposed to Ratchaburi’s 22nd place).
Main causes of pollution would be the aforementioned vehicular emissions, with hundreds of thousands of daily commuters making their way across, and in and out of the city, causing levels of pollutants such as sulfur dioxide (SO2) and nitrogen dioxide (NO2) to skyrocket to unhealthy levels, the effects of which will be discussed in short.
Other causes would be industrial areas, with numerous factories and production plants dotted around the city’s limits, dealing in food products, industrial goods manufacturing, as well as all manner of power plants responsible for providing electricity to the citizens, but at the same time going through copious amounts of coal and other pollutant laden fuels to provide said energy.
These are the main sources of pollution, with other ones being dust and fine particulate matter from construction sites and road repairs, as well as trans-border smoke being blown over from forest fires in Indonesia during certain times of the year (although this is more prominent in southern Thailand, due to its closer proximity).
When is pollution at its worst in Ratchaburi?
Regarding the numbers recorded over the course of 2019 as a reference point (with 2020’s readings being skewed somewhat due to massive lockdowns imposed due to the covid-19 outbreak, hence 2019’s readings are a more accurate indicator of what true pollution levels are like), there emerges a fairly distinct pattern as to when pollution levels are at their highest.
Smog, haze, fumes and smoke would all start to rise in level towards the end of the year, with PM2.5 readings starting to show a noticeable rise in October. Septembers reading came in at 15.1 μg/m³, before making a significant jump up to 24.2 μg/m³ in October. These numbers continue to rise as the months go on, with massive jumps up to 40.7 μg/m³ and 53.8 μg/m³ in November and December.
Pollution levels reached an all time peak in January, with a dangerous reading of 78.5 μg/m³ being taken, putting that month in the ‘unhealthy’ ratings bracket, which as the name implies has a vast amount of detrimental effects on all portions of the population.
From here the pollution levels start to abate down to better readings, receding until the month of April where a period of ‘lesser pollution’ is reached, albeit still containing months of imperfect PM2.5 readings. To finish, the most polluted time of the year in Ratchaburi is November through to January of the following year, with January coming in at the most polluted.
When is air quality at its best in Ratchaburi?
Following on from the previous question, as mentioned, the pollution levels start to show recession after January, with the massive reading of 78.5 μg/m³ falling down to 34.1 μg/m³ in February, then down to 32.4 μg/m³ in March, and then a more normal reading of 19 μg/m³ in April, although by any standards this is still fairly elevated, being 9 units of measurement away from the World Health Organizations target goal for great air quality (10 μg/m³ or less).
Regarding Ratchaburi’s air quality, the period between April and September is when the air pollution stayed lower, with the months of July through to September coming in with the best PM2.5 readings, which were 17.2 μg/m³, 10.2 μg/m³ and 15.1 μg/m³ resepctively, making August the cleanest month of the year and also the only month to achieve a ‘good’ ratings status, which requires a fine margin of entry at 10 to 12 μg/m³.
What are some health issues associated with polluted air in Ratchaburi?
With readings as high as the ones taken in January, as mentioned there would be a vast amount of health issues associated with such elevated levels of pollution. Of note is that any PM2.5 reading over 10 μg/m³ has the ability to cause adverse effects, and as such, as these readings rise so does the chance of these ill effects occurring as well as the severity.
Some of the health issues would include short term ones such as irritation to the mucous membranes, the eyes, mouth, nose, throat and also the skin. Rapid ageing and scarring of the lungs can occur, specifically when breathing in pollutants such as fine particles of black soot or sulfur dioxide.
Besides reducing full lung function and lowering life expectancy, they can also make individuals more susceptible to respiratory diseases such as pneumonia, bronchitis, emphysema and asthma. These are but a few of the ill effects that may occur if one is over exposed to pollution in Ratchaburi, with factors such as age, health as well as daily life also being major factors (with those who live near industrial areas or those who have to take a highly polluted daily commute being most at risk, along with their relevant health status).


