
Bangkok air quality map
Live air pollution map of Bangkok • 16.9M Followers • 09:00, Jun 06 Local time

Stations
Clean Air Facilities
Contributors
Government
5Diplomatic
2Non-profit
8Education
100Corporate
39Healthcare
1Hospitality
4Individual
185Top contributors in Bangkok
Who is sharing outdoor air quality data in Bangkok?
Featured station
Discover some of the best station installation in Bangkok
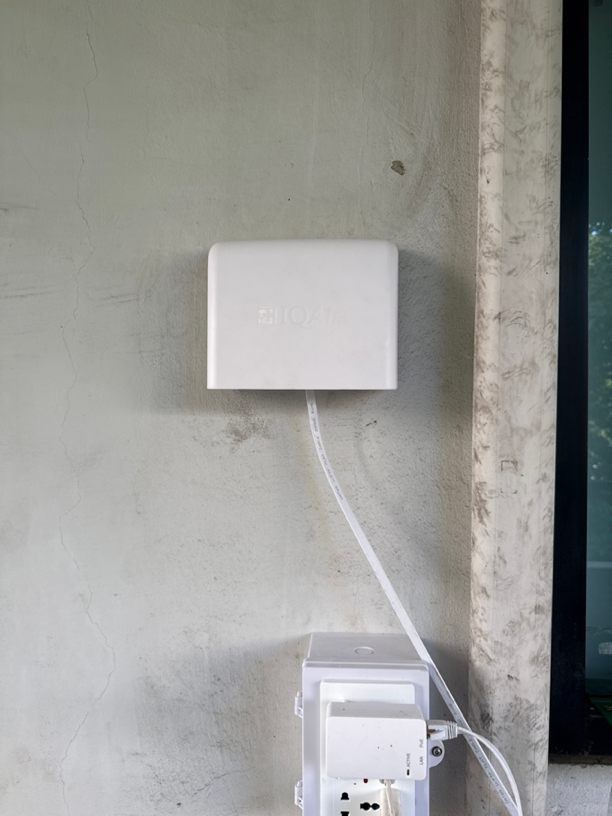
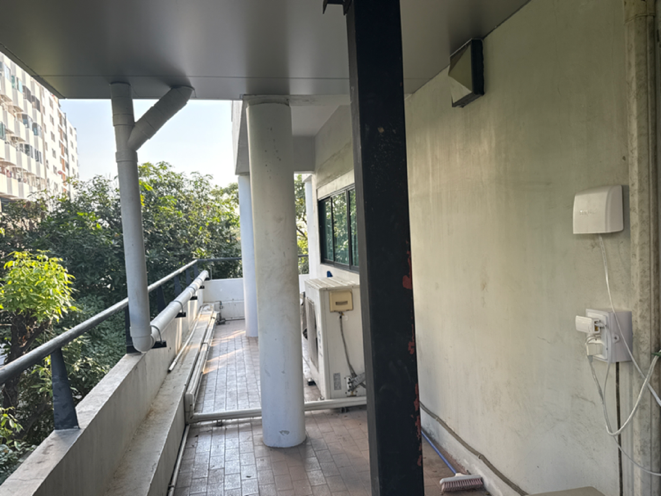

Station gallery

Intronics Research Centre, Bangkok
33
Newest stations deployed in Bangkok
AQI⁺ station rankingNewest stations


Learn more about global air quality


Learn more about air pollution in Bangkok
Is Bangkok a polluted city?
Bangkok, the capital of Thailand, is a very densely populated city, with over ten and half million people estimated to be living there in 2020, with a city size of 1,569 km². In 2019 the average reading of fine particulate matter in the air, or PM2.5, was found to be concentration of 22.8 μg/m3. This puts it at a ‘moderate’ rating according to the US Air Quality Index, which according to the stringent US standards of measurement, is any number between 12.1 to 35.4μg/m3. Observing data taken from 2019, the months of June through to August are the months that have the cleanest levels of pollution, with drastically lowered PM2.5 ratings.
Reasons for the lowered PM2.5 readings may be directly linked to seasonal influence, with the rainy season starting at around July and lasting till October. The rain offers a cleansing to the air quality as it naturally pulls the fine particulate matter and other pollutants such as nitrogen dioxide (NO2) and sulfur dioxide (SO2) out of the air.
However, despite the readings classing it at a moderate level, there are times when it crosses rapidly over this line to significantly worse pollution with levels of PM2.5 and other contaminants found lingering in the air. A large number of schools were closed in January of 2019, an unprecedented order at the time because the level of air quality has only something that has recently been made more transparent and available for the average citizen, as well as the government keeping a closer eye on it. The schools were closed in order to protect children from a particularly heavy haze that persisted for several weeks.
During this time, in the month of January during 2019, the levels of PM2.5 rose significantly higher than the rest of the year to a reading of 47.4 μg/m3, putting it in the ‘unhealthy for sensitive groups’ bracket of the US AQI. Whilst this presents significant health risks on certain demographics of people, including the young and elderly, as well as those with respiratory problems such as COPD (chronic obstructive pulmonary disease), Bangkok actually came in at a ranking of 48th most polluted city in the whole of Thailand, out of 68 cities recorded on the database. This may come as a surprise to many people, due to the extremely large number of vehicles on the road, the heavy tourism year in and year out (an industry that has come somewhat to a halt in the year of 2020 due to the outbreak of COVID-19). Many visitors and locals alike who have had to traverse the streets of Bangkok know how intense the pollution and haze can get, with visible smoke lining the air and thick black soot covering many of the city’s roadsides and underpasses.
Despite these discrepancies, Bangkok remains as its own entity, with a low ranking of pollution and PM2.5. Yet it is still capable of becoming rapidly more polluted in a very sudden manner, and as such visitors or residents should keep an eye on the air quality index rating, or the Bangkok air quality map, which shows live updates of the PM2.5 and other pollutant levels across the city. AirVisual’s air pollution app can help to provide live information and updates on such readings.
What causes deterioration of air quality in Bangkok?
There are many things that factor into the pollution levels in the city of Bangkok. The exhaust fumes from automobiles are among one of them, the burning of plants and other organic matter in the farming industry releasing its own fair share of smoke and volatile organic compounds (VOC's) into the air, in addition to the boating industry. Bangkok is tied together by a lengthy series of waterways and canals, that are imperative for the livelihood and travel of the city’s residents, as well as providing for many other industries such as tourism and travel, both touristic and residential commuting. It is estimated that over 300,000 boat trips are taken every single day (estimates taken at the beginning of 2020 before imposed lockdown).
The main issue within this industry is that these boats are powered primarily by diesel engines, which inevitably release large amounts of pollution and PM2.5 into the atmosphere, along with black carbon (BC), a dangerous pollutant formed from the incomplete combustion of various biomass and fossil fuels combined. This can take a heavy toll on the quality of the air, with even post COVID-19 readings pushing themselves dangerously high, a reading on the 10th of November 2020 coming in at 92 on the US AQI.
The deterioration is caused by the choking levels of traffic, both on the roads and on the waterways, the burning of agricultural material which releases large amounts of smoke and PM2.5 into the atmosphere, as well as pollution from factories and the industrial sector.
How can Bangkok’s air pollution be reduced?
For a start, the reduction in vehicle emissions would go a long way to reducing the overall level of pollution in Bangkok’s air and reducing its levels of PM2.5, as well as improving its air quality. Measures are already being taken to reduce the massive number of vehicles on the road at certain given times, but these measures are fairly transient and fail to put a dent into the long term AQI rating.
Many of the boats that populate the waterways release large amounts of pollution and PM2.5 and black carbon, and whilst Thailand and other neighboring Asian countries are on the brink of bringing their motorization rates to that of developed countries, there still remains to be a lack of strict fuel standards in regards to the quality of the fuel that is being used, with subsequent exhaust fumes exceeding what would be considered low-emitting standard.
Further measures to reduce the amount of pollution emitted from the burning of organic materials in the farming sector and other related industries would also go a long way, along with more stringent rules on the fume emissions from factories. As these three things are the main culprits in terms of contributing to the higher pollution levels and poorer air quality ratings, an implementation of stricter rules in the farming, vehicular and factory/industry sectors would be a good step to lowering air pollution emissions.
How does Bangkok’s air quality compare to other cities in Thailand?
According to the 2019 air quality index ratings of Thailand, it is shown that indeed Bangkok is significantly lower down on the list of most polluted cities. To give some examples of cities that have worse air quality or higher levels of pollution, the well-known city of Chiang Mai had an average PM2.5 rating of 32.3 μg/m3 as compared to Bangkok’s rating of 22.8 μg/m3. Chiang Mai saw PM2.5 ratings of 98.7 μg/m3 in March and 74.1 μg/m3 in April, ratings that catapulted it into the ‘unhealthy’ rating of the US AQI, far surpassing any readings taken in Bangkok during that year. By contrast the months of June through to August saw PM2.5 readings that fell into the WHO’s target rating of below 10 μg/m3, something that Bangkok failed to achieve throughout 2019. However, the months of March and April were high enough to give it a higher yearly average than Bangkok, in regards to its air pollution.
This gives one example of a comparison to other cities in Thailand, as can be found within IQAir’s 2019 World Air Quality Report. They follow a fairly thematic pattern of pollution spikes in certain months and drops during the rainy season, with variations of these numbers appearing across the 68 ranked cities.
What are the health impacts of pollution in Bangkok?
Numerous studies have been conducted on the effects of PM2.5 on the human body, and the results of being exposed to it over long periods of time. The other particulate matter of a larger size, of a width of 10 or less micrometers across (PM10), whilst larger than the more lethal PM2.5, are still small enough to enter via the respiratory tract and end up in the lungs, causing potential issues to both the lungs and the heart. PM2.5 on the other hand, being of a much smaller size (particles with a diameter of 2.5 micrometers or less) has the ability to not only get into the body via the respiratory tract, but can enter the bloodstream whereby they gain the ability to circulate to the rest of the body, causing much more adverse health impacts.
On a short-term basis, these health effects may include irritation to the eyes and nose, as well as the throat or other mucous membranes. PM10 can worsen cases of asthma, triggering attacks leading to other numerous forms of COPD. People with preexisting heart problems or diseases may find their condition worsening, with heart attacks or arrythmias (irregular heart beat) also possible.
Longer term exposure can lead to even more reduced lung function, or a worsening of COPD symptoms, as well as reduced life expectancy from the development of diseases affecting both the respiratory system and heart. PM2.5 cannot be easily removed from the body, if at all, making the need for the reduction of pollution and air filtration systems ever more important.
Commuting down the roads or waterways of Bangkok on a daily basis could have highly negative effects on a person’s health and a significant reduction in life expectancy, and as such mask use is recommended, as well as being aware of the pollution forecast and the daily levels of PM2.5 in the air.
Where is the cleanest air quality in Bangkok?
- GappyZ HQ6
- Baan Kin8
- Kasetsart university laboratory school 1, Chatuchak, Bangkok8
- Sansiri - The Base Phetkasem8
- Soi Pattanasin8
- Magi HQ9
- The Lofts Asoke - sukhumvit 219
- OatState Home - Baan Klang Muang Phaholyothin 5011
- SM HQ11
- MI Home12
- Soi Ramintra 6212
- Soi Sukhumvit 31, High floor12
- Sukhumvit101/112
- UN Garden12
- Siam Hospital Supply Co., Ltd. - Building14
- Suwannaramwittayakom school 1, Bangkok Noi, Bangkok15
- Mityothin, Chatuchak, Bangkok16
- Snoozer Labs (Tantip Village)16
- Duang Prateep Foundation HQ17
- Grandio BangKhae17
- Kensington17
- Kensington International School - Primary17
- Kensington Learning Space17
- Khlong San17
- MPS Indoors17
- Regents Langsuan17
- Sukontasawat1917
- Thonburi17
- Wimalee Residence Bangmod17
- Life Bangkok Boulevard (Raminthra 105)20
- Dusit District21
- Terd Thai21
- Vibhavadi Rangsit 11 Alley Lane 1021
- Bangkok Christian International School 222
- Bangkok Tawiwit Bilingual School22
- Berkeley International School 322
- Brighton College22
- Charter International School22
- Fouart (1994)22
- Garden International School Bangkok 222
- Glory Singapore International School Ramintra22
- HEI Schools Bangkok22
- Intamara 3722
- International Community School (s)22
- Kiak Kai Intersection22
- Ladprao 41 Yak 1422
- Learn Satit Pattana School22
- Lycee Francais International de Bangkok LFIB22
- MANTANA Bangna Wongwaen22
- Masterpiece Rama922
- Narasiri Topiary Village22
- RAJINI SCHOOL22
- Raintree International School Sathorn22
- Residence 4922
- STOCK EXCHANGE OF THAILAND22
- Seri Village22
- Shrewsbury City Campus22
- Shrewsbury Riverside22
- Sook Sumraan: Sun-Powered Boat22
- Thai Christian School 222
- The Star Estate22
- Windshell22
- XCL ASB22
- Bangkapi District23
- Tang Trong Chit Alley23
- Circle Living Prototype24
- Lock 1-2-3 (13.7121923, 100.5740800)24
- Soi Naradhiwas Rajanagarindra 17/124
- Suan Luang26
- Thung Hua Sinn Group26
- Anglo Singapore International School Campus 3127
- Bangkok River Park Condominium27
- Brighton College International School27
- De Botan Srinakharin27
- Hampton International Pre-School Sathorn27
- Heathfield International School 227
- International Community School (a)27
- Kids' Academy Discovery Campus27
- LPN Rama 4 - Kluaynamthai27
- La Petite Ecole - International School27
- Nantawan Sathorn Ratchaphruk27
- Outdoor School Bangkok (OSB)27
- Patai Udom Suksa School27
- River House27
- School Gymnasium27
- Setthasiri Charan-Pinklao227
- Siamsaamtri School27
- SummerDash27
- Thai Christian School 127
- Uno Solutions27
- Wisdom Nebulae Montessori School27
- 15 Sukhumvit Residences28
- ACACIA International Preschool Sathorn28
- ACACIA International Preschool Sukhumvit28
- AirVisual-TJAS28
- Amnuaysilpa School28
- Baan Ladprao28
- Bangkok Christian College -BCC15028
- Beaconhouse Yamsaard International School28
- Burasiri Watcharapol28
- CCSup28
- Canvas 3928
- Charan Mansion28
- Embassy of Belgium28
- Esta Home Private Park28
- HOOK.CO.TH28
- Hummingbird Inter Kindergarten28
- KAEGOOGLE28
- KHIBHU House28
- LADAWAN RAMA228
- LIGMAN Lantern Building Floor 228
- Lat Phrao Soi 1 Yaek 2128
- M. Panya Soi 2528
- Metropark Condo Phase 128
- NARASIRI KRUNGTHEP KREETHA28
- NIVA AMERICAN INTERNATIONAL SCHOOL28
- Nantawan Ram 9428
- Navatanee Soi 428
- Near Fashion Island 228
- Ngam Wongwan 45 (N.Team)28
- Palina Kindergarten School28
- Pan-Asia International School28
- Punnawithi-CCRRRST28
- Ram Inthra 928
- Resident Longcat Outbreak28
- Robin Extend28
- S TECHNOLOGY & SOFTWARE28
- SBS International School28
- SPIP28
- SRICHAND แป้งฝุ่นโปร่งแสง กัน PM2.528
- Saimai 5028
- Saphan Kwai28
- Sasin School of Management28
- Satit Chula Elementary School28
- Satri Witthaya 2 Soi 2928
- Setthasiri Charan-Pinklao28
- Singapore International School Thonburi28
- Soi Meathinivase28
- Soi Sailom 128
- St.louis Grand Terrace28
- Sukkai Sabaijai Pharmacy - PTT RR28
- Thanathamrong Village28
- The Athenee Hotel28
- The Ritz-Carlton Residences (Outdoor)28
- The Room Sukhumvit 62 Condo28
- Traill International School 228
- VC Petcharat28
- WC House28
- [Wellington College] Junior School Entrance28
- 19-51 Soi Sangchai29
- Benchasiri Park (Benjasiri Park), Khlong Toei District29
- Soi Rimthang Rotfai 329
- Suriya Thep Alley29
- Lumpini Park, Pathumwan District32
- Soi Mu Ban Phiman Prida32
- 170 Sukhumvit8133
- 252 HOME33
- Aon's house33
- Army Apartment Sam Sen33
- Ascot International School33
- Assumption College Thonburi33
- BAFS-DMK33
- BASIS International School Bangkok33
- BEYC International Kindergarten 233
- Bangchan School33
- Bangkok International Christian Nursery BICN33
- Bangkok Port (OB Building)33
- Bangkok Prep33
- British Columbia International School Bangkok33
- British Mandarin School (BMIS)33
- COM7 PUBLIC COMPANY33
- CVNART Sukhumvit 7/133
- Central Chest Institute of Thailand33
- Centro Bangna-Wongwaen33
- Centro Rama9 Krungthep Kreetah33
- Chartered Square Building33
- Energy Complex33
- Fullerton Sukhumvit33
- Garden33
- Garfield @Grand Britania33
- Golden Lanna, Ramkamheang 9233
- IQAir Thailand - Vibhavadi 2233
- Intronics Research Centre33
- Joy Kindergarten33
- KARGO GLOBAL LOGISTICS33
- KIDSBangna33
- Kids Kingdom International Kindergarten 333
- Kirakira Kids International Kindergarten33
- LIGMAN Lighting33
- Ladawan Kaset Nawamin33
- Ladprao 112 Gardenview33
- MABIS33
- MANA Specialty Coffee ข้างรพ. วิชัยยุทธ33
- MK Restaurant Group Public Company Limited33
- Millenium33
- Mu Ban Nanthawan Onnut 4433
- NAVARA RAMA 233
- NAWAMIN ROAD33
- Nawamin33
- Neurological Institute of Thailand33
- Noddy by Elizabeth Preschool33
- On-Nut 65 Alley33
- PSP Demonstration School33
- Park Silom33
- Pattanakarn 20 yaek 633
- Pattanakrn Soi 7433
- Phatthanakan Soi 3233
- Piyanon Village33
- Plearnpattana School33
- Prom School 233
- Prukpirom Sathorn - Ratchaphruek33
- R Plus Clinic33
- RIS Early Years Campus, Prayasuren Rd. (Outdoor)33
- Rangsiya Village33
- Rojjirapa Kindergarten33
- Royal Park33
- SENA NIWET SOI 21433
- SaiThong Ratchada 3633
- Salanamron Market33
- Sathorn Tai Road33
- Satit Chula Secondary School33
- Setsiri 2 RD33
- Showpow Bike Shop Onnut 46/233
- Siam Hospital Supply Co., Ltd. - Building 133
- Silpakorn University33
- Siripen School33
- So Origin Phahol 69 Station33
- St Andrews international School Bangkok Primary School Campus33
- St. Andrews International School Sukhumvit 10733
- St. Andrews International Schools Sathorn33
- Suksawad14/1833
- TDRI 233
- TSI International School (Wongwianyai Campus)33
- TSM GROUP (Yot-Se)33
- Taveepanya33
- TawanMcweis Latprao Soi 1533
- Thai Airways Head Office33
- Thawsischool33
- The Privatier Ratchada 3233
- The Residents at Sindhorn Kempinski33
- The Sukhothai Bangkok33
- Thian Thale33
- Tiny's house33
- Trisak Automation33
- VC college33
- Wattana Wittaya Academy33
- piya home33
- Taling Chan District34
- Nana Nue Pier35
- Din Dang37
- AISB Highfield38
- AISB-Primary Campus38
- Annabel’s Early Years38
- Baan-Suan Tha-Phra38
- DenlaKindergarten38
- Enrich Park38
- Kids Kingdom Ruamrudee International Kindergarten38
- Kikiriri at DMK38
- King's College International School Bangkok38
- Ladawan Ratchpruk-Pinklow38
- Life Bangkok Boulevard38
- NOBLE WANA WATCHARAPOL38
- Pracha Niwet Natures Garden38
- Prannok x PhutthaMonthon 2 Intersection38
- Ramintra Sports Park, Bang Khen District38
- St. Andrews Dusit AQI38
- The Tiny Seeds International Pre-School38
- Visit home38
- Wachirabenchatat Park, Chatuchak District38
- Aster International School39
- Bangkok Christian College - Sirinart39
- Bangkok Hospital39
- Bangkok Port (Terminal 1 Building)39
- Casa viva Condominium39
- Darul Muqarrabin Mosque (Lam Hin) Preschool Development Center39
- Embassy of Switzerland39
- GUB39
- Homeplace Village39
- IBS Nimitmai campus39
- IBS Seri Thai Campus39
- Inthapat 9 Phetkasem 6939
- KPI Tower (Outdoor)39
- Khlong Chan Place Condo39
- Laddarom Elegance Rama 239
- Le Siam Hotel39
- Manthana Lake Watcharapol, Saimai39
- Navatanee Main Road39
- On Nut 8039
- Owat Maid39
- Panya Village P1 7/139
- Park Heritage Phatthanakan39
- Parntawan Kindergarten39
- Phraya Suren Child Development center39
- Phrom Si 239
- Premium Time Home Village (Suanluang Rama IX)39
- Putthabucha1539
- Regent's International School Bangkok39
- SAI 2 SOI 3339
- STGK Suanpak39
- Sittarom Regent Sri Nakarin Village39
- Southeast Asia University39
- Srithaigranites (ศรีทัยแกรนิต)39
- Sumrae39
- The Practical Solution PLC39
- Tim+’s Home39
- Town Plus39
- UnReal Gym39
- VPPW Office MD39
- WachirathamSathit 2339
- Wat Saen Kasem School39
- [Wellington College] Senior School Entrance39
- Bang Khae Phirom Park, Bang Khae District41
- Bangkok Noi District43
- Chom Thong43
- Huai Khwang District43
- 276/137 Manthana Srinakarin-Romklao44
- 456 Krisadanakorn Pinklao44
- 6th Ave. Sukhumvit 1544
- AISB Innovation Centre44
- BKK GRAFF44
- Baan Thapra44
- Ban Rim Num Condo, Chaophya Hospital44
- Bang Sue District44
- Brighton College International School Bangkok Vibhavadi44
- Bueng Kum District44
- Chaidee Mansion Sukhumvit 1144
- Data Entry Group44
- Donmuang hotel44
- Ekamai International school44
- Glory Singapore International School44
- I.C.C. INTERNATIONAL Co.,Ltd.44
- IDEO Ratchada-HuaiKhwang44
- JANANAN Outdoor44
- Kamalul Islam Mosque Community Child Development Center44
- Kanchanaphisek sai2 park44
- Ladprao 6444
- Lets Asia44
- Line @thehappyteeth93 / Sukhumvit 93 Phung Mi 2644
- Manthana (Onnuch-Wongwan 3)44
- Na Daroon School44
- Newton Tower44
- Nong Khaem Southeast Asia University44
- OR PKN44
- PRANGTHIP KINDERGARTEN44
- Panyarat High School44
- Passorn Songprapa44
- Prinn Sathorn Ratchapruk44
- Raintree International School Sukhumvit44
- Roong Aroon School44
- SJP Information System Co., Ltd. - Office44
- SYSTEMS DOT COM44
- Sindhorn Offices44
- Siri Sukhumvit Soi 844
- Siriwang Phatthana Child Development Center44
- Soi Samahan44
- Sunshine engineering and construction co.,ltd.44
- Vespiario Company Limited44
- Phaya Thai District (Khor Por Station)45
- Don Mueang District46
- Suan Sayam-Ram Intra Intersection46
- Thung Khru District47
- Wattana District47
- Anglo Singapore International School Campus 6449
- CSPM Thailand49
- Panya soi 3249
- Premwadee Village, Soi 549
- Sukkai Sabaijai Pharmacy - HQ49
- Yip In Tsoi Group49
- Bang Rak Lovely Plaza50
- Dental Click(outside)50
- FSB International School50
- Oleander Soi11 BKK50
- RePower50
- SCG Headquarters Bangsue50
- The First Steps International School50
- soi Phrapinij, Narathiwat Road50
- Bang Bon 5 Market51
- Bansomdejchaopraya Rajabhat University51
- Bodindecha Sing Singhaseni School51
- BERKELEY KINDER52
- Bang Khae District52
- Bangkok Boulevard Rama952
- Bangna District (Khor Por Station)52
- Cafe Velodome52
- ELIO DEL RAY52
- Kamnan Maen 20 Alley52
- Nonsi Witthaya School52
- Saphan Sung District52
- Si Trang Village52
- UTCC Library52
- Her Majesty the Queen's 60th Birthday Anniversary Park, Lat Krabang District53
- Sukhumvit 33 - Limtanakool Family53
- Wat Wimutayaram School53
- Watpakbor sc out53
- 333 Riverside54
- Min Buri54
- All Weather Farm55
- Bang Khun Thian District55
- Bang Khun Thian District (Khor Por Station)55
- Dcondo tan55
- Ekkachai 855
- Fortress area of enemies defeated55
- Lak Si District55
- Pathumwan District (Khor Por Station)55
- Sathorn District55
- Siam Hospital Supply Co., Ltd. - Building 655
- Thon Buri District (Kor Por Station)55
- Wang Thonglang District (Khor Por Station)55
- Bang Phlat District56
- Ladprao 35 Yak 2-356
- National Housing Authority Dindaeng56
- Phetkasem 3756
- Wake and Grow Coffee - Suanluang Rama956
- Wang Thonglang District56
- Rat Burana District57
- Yannawa District57
- Bang Khen District Office58
- Chai Charoen Supplies Company Limited58
- Pathumwan District58
- Phra Nakhon Station58
- Prinyada Kaset-Nawamin58
- Nong Chok District60
- Khlong Sam Wa District61
- Rommanee Park, Thung Si Kan, Don Mueang District61
- Khlong Toei District62
- Samphanthawong District62
- Ladphrao District Office64
- Chatuchak Station68
- Lat Krabang69
- St Andrews international School Bangkok High School Campus69
- Bangna District70
- Tha phra Intersection74


