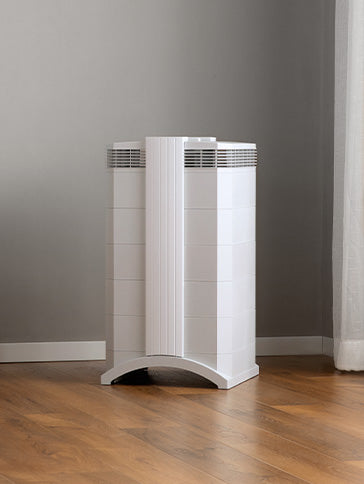
获取您自己的监测仪,亲自测量您城市的空气吧。


| 天气 | 雾 |
| 温度 | 95°F |
| 湿度 | 26% |
| 风速和风向 | 8.1 mp/h |
| 气压 | 29.6 Hg |
| # | city | 美国 AQI |
|---|---|---|
| 1 |  Noida, 北方邦 Noida, 北方邦 | 177 |
| 2 | Faridabad, 哈里亚纳邦 | 174 |
| 3 | 古尔加翁县, 哈里亚纳邦 | 167 |
| 4 | Ghaziabad, 北方邦 | 160 |
| 5 | 德里, 德里 | 156 |
| 6 | New Delhi, 德里 | 156 |
| 7 | Gwalior, 中央邦 | 153 |
| 8 | 密拉特, 北方邦 | 153 |
| 9 | Kanpur, 北方邦 | 142 |
| 10 | Aurangabad, 马哈拉施特拉邦 | 141 |
(当地时间)
查看世界AQI排名
| # | station | 美国 AQI |
|---|---|---|
| 1 | Vikas Sadan, Gurugram, Haryana - HSPCB | 181 |
| 2 | Sector-2 IMT, Manesar - HSPCB | 168 |
| 3 | Sector-51, Gurugram - HSPCB | 166 |
| 4 | Orchid Island Gate No 1 | 119 |
(当地时间)
查看世界AQI排名
美国 AQI
167
实时空气质量指数(AQI)
不健康

| 空气污染等级 | 空气质量指数(AQI) | 主要污染物 |
|---|---|---|
| 不健康 | 167 美国 AQI | PM2.5 |
| 污染物 | 浓度 | |
|---|---|---|
| PM2.5 | 78.6µg/m³ | |
| PM10 | 203.2µg/m³ | |
| O3 | 20.1µg/m³ | |
| NO2 | 15.2µg/m³ | |
| SO2 | 3.2µg/m³ | |
| CO | 970µg/m³ | |
PM2.5
x15.7
古尔加翁县当前的PM2.5浓度是WHO空气质量年平均指导值的15.7倍
| 天 | 污染等级 | 天气 | 温度 | 风速和风向 |
|---|---|---|---|---|
| 星期日, 6月 2 | 对敏感人群不健康 112 美国AQI  | 109.4° 93.2° | ||
| 星期一, 6月 3 | 不健康 163 美国AQI | 111.2° 89.6° | ||
| 星期二, 6月 4 | 不健康 182 美国AQI | 111.2° 93.2° | ||
| 今天 | 不健康 167 美国AQI | 111.2° 93.2° | ||
| 星期四, 6月 6 | 对敏感人群不健康 144 美国AQI | 111.2° 91.4° | ||
| 星期五, 6月 7 | 不健康 165 美国AQI | 113° 91.4° | ||
| 星期六, 6月 8 | 不健康 159 美国AQI | 113° 93.2° | ||
| 星期日, 6月 9 | 不健康 151 美国AQI | 113° 95° | ||
| 星期一, 6月 10 | 不健康 159 美国AQI | 114.8° 95° | ||
| 星期二, 6月 11 | 不健康 163 美国AQI | 113° 95° |
想了解每小时预报吗? 下载App
Located in the Indian state of Haryana, Gurugram can be also known as Gurgaon. Gurugram is a leading financial center as many major Indian cities such as Mumbai and Chennai. Gurugram has the reputation of having one of the world’s worst air quality, altough there has been improvments over 2019. Indeed, from 2017 to 2018, Gurugam annual average AQI improved from 197 to 192. To put this in context, the Air Quality Index (AQI) is divided into six categories:
| AQI | Air Pollution Level |
| 0 to 50 | Air quality conditions are good |
| 51 to 100 | Air quality conditions are qualified of moderate |
| 101 to 150 | Air quality is unhealthy for sensitives groups (for example people with respiratory problems, older and younger people) |
| 151 to 200 | Air quality becomes unhealthy for everyone |
| 201 to 300 | Air quality is very unhealthy and dangerous |
| 301 to 500 | Air quality is hazardous : Health Alert |
Looking at the AQI scale, we know that between 2017 and 2018, the average annual air quality conditions in Gurugram were considered unhealthy for sensitive groups which is far behind the pollution exposure recommendations of the World Health Organization’s guidelines. Gurugram's 2019 air pollution data are encouraging and give hope for the future.
In 2018, Gurugram ranked number 1 most polluted city in our IQAir AirVisual’s 2018 World Air Quality Report. The city is only about 30 kilometers away from Delhi, the Indian capital which reached an annual PM2.5 average concentration of 135.8μg/m³ during 2018.
In march 2019, Gurugram was again named the 7th most polluted city in the world by the IQAir Visual's 2019 World Air Quality Report Report.
One of the main reasons for Gurugram's air pollution is dust, coming from different sources. One part of the dust is coming from neighboring areas and the intensive construction's activities as Gurugram is developing rapidly.
Another reason explaining the current Gurugram air pollution is the transporation-related gaz emissions. Where the Indian capital Delhi has CNG (Compressed Natural Gas) requirements for public transport, this regulation measure hasn’t been enforced in the Gurugram area. For example, vehicles spewing black smoke are not currently regulated which leads to important gazes emissions in the city.
A third reason is the use of Diesel, for cars and generators. In Gurugram, no restrictions from the government has been taken to control the excessive utilization of gensets at this time.
Indian authorities have launched a new project called the NCAP (National Clean Air Program), to cut pollution by 20% to 30% in 102 of the most polluted cities in the country with a target to 2024. The objective is to reduce transport and industrial emissions, lower the dust pollution, and take limiting rules on biomass burning.
The GRAP (The Graded Response Action Plan) has been implemented in 2018 to ensure that actions are taken to improve Gurugram air quality. Several measures have been taken:
Over the last years, Indian government acquired more air quality monitoring stations, especially in the Haryana state where Gurugram is located. Thanks to IQAir, all Gurugram's Residents have now access to the pollution levels rate in the city and air pollution forecasts.
Different signals can indicate that the air pollution is affecting your health. If you feel more tired than usual, pollution can be the cause as it is known to increase fatigue. Bad air quality can weaken your immune system and reduce body resistance to infections.
Chest pain, headache, nausea and dry throat can also be signs of air pollution affecting your well-being. If you already have respiratory disease such as asthma, the pollution can make it worse. Wearing good quality face mask when air pollution is high is one of the best choices you can make to protect yourself and your family