


 أضف
أضفجودة الهواء في San Leandro
مؤشر جودة الهواء (AQI⁺) وتلوث الهواء بـ PM2.5 في San Leandro • 44.5K Followers • 21:00, أكتوبر 19 التوقيت المحلي
9
US AQI⁺جيد

الملوث الرئيسي:
PM2.5
1.7 µg/m³

13°

12 km/h

86 %
التنبؤ بالساعة
توقع مؤشر جودة الهواء (AQI⁺) في San Leandro


التوقع اليومي
توقع مؤشر جودة الهواء (AQI⁺) في San Leandro
| اليوم | 28 |  | 19° 13° |  10 km/h | 67% |
| الثلاثاء | 41 | | 18° 15° | 18 km/h | 70% |
| الأربعاء | 45 |  | 17° 14° | 13 km/h | 76% |
ملوثات الهواء
ما هي جودة الهواء الحالية في San Leandro؟

تركيز الجسيمات الدقيقة PM2.5 يلبي حاليًا إرشادات منظمة الصحة العالمية السنوية للجسيمات الدقيقة PM2.5.

توصيات صحية
 Enjoy outdoor activities |
 Open your windows to bring clean, fresh air indoors Get a monitor |
احمِ نفسك من تلوث الهواء في San Leandro

راقب الهواء الذي تتنفسه
احصل على قراءات دقيقة لجودة الهواء من AirVisual ورؤى في الوقت الفعلي للحصول على هواء أنظف. شاشات تكشف عن مصادر التلوث، وتسلط الضوء على وقت الحاجة إلى استخدام جهاز تنقية الهواء.

أجهزة تنقية هواء من الدرجة الطبية
تستخدم سلسلة HealthPro Series الموثوق بها في جميع أنحاء العالم تقنية HyperHEPA. تقوم بتصفية الجسيمات متناهية الصغر التي لا تلتقطها أجهزة تنقية الهواء الأخرى، مما يوفر حماية طبية من الدرجة الأولى.

أجهزة تنقية هواء قوية وأنيقة
تجمع سلسلة Atem Series، المدمجة والقوية، بين الهندسة السويسرية والأداء العالي لتنقية الهواء، وتصفية الجسيمات متناهية الصغر باستخدام تقنية HyperHEPA.
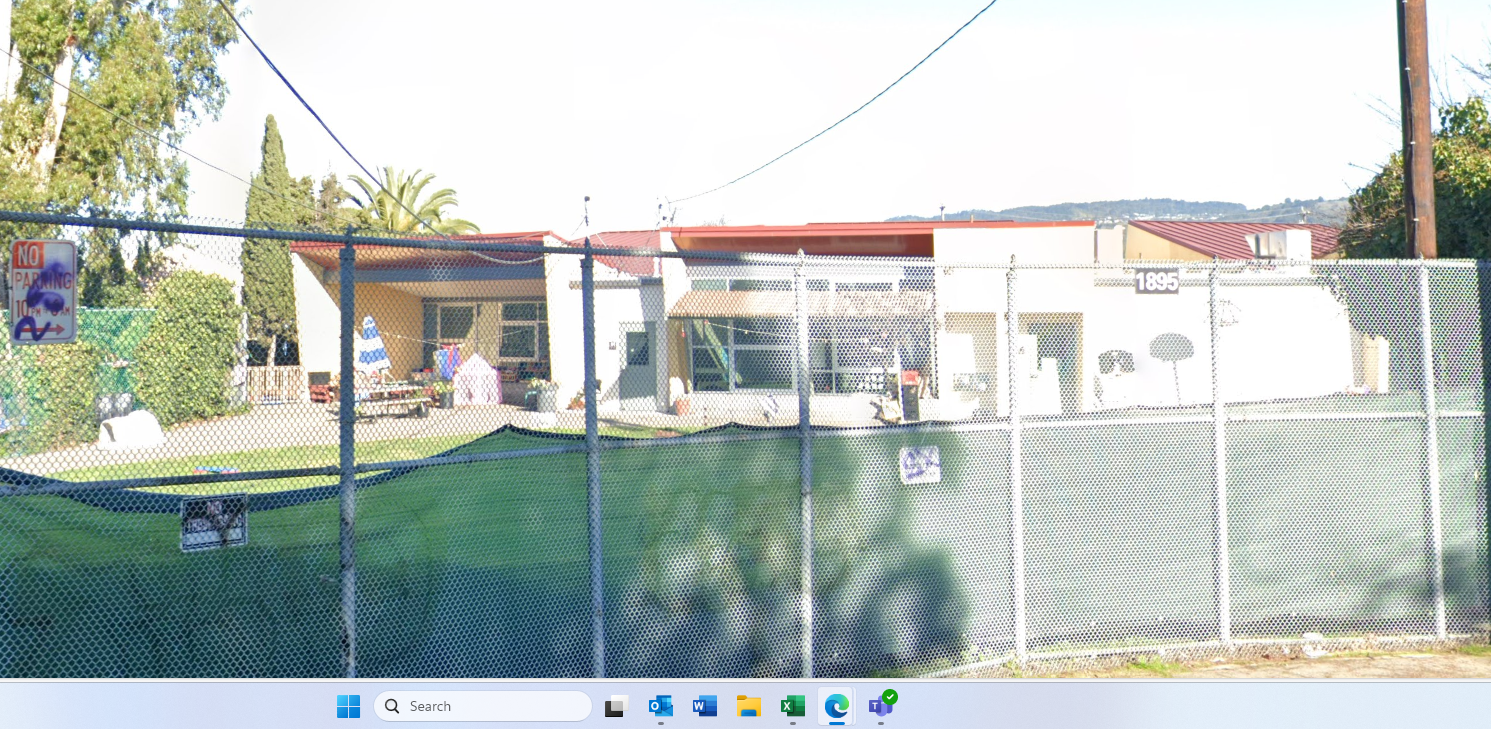
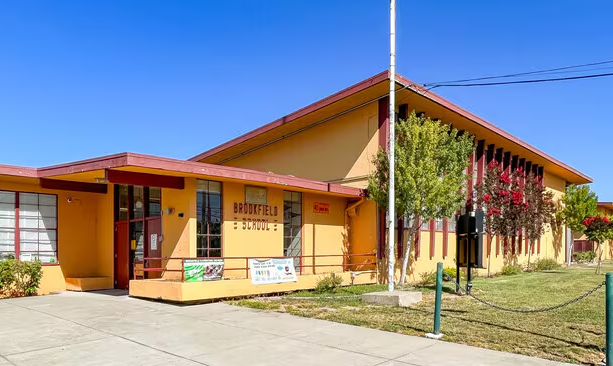
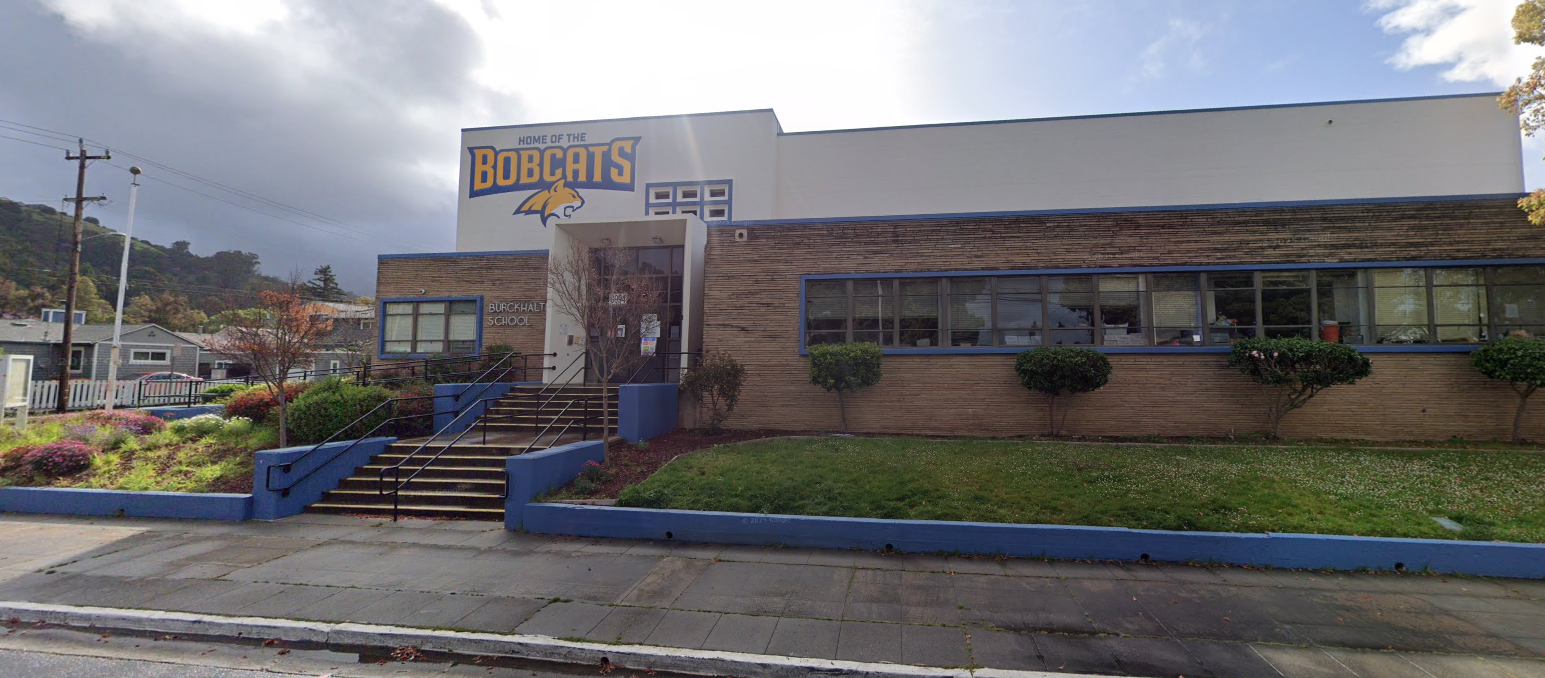
مرافق الهواء النظيف
حبوب اللقاح
ما هو عدد حبوب اللقاح في San Leandro اليوم؟
المؤشر

منخفض
 شجرة لا شيء | 0% |
 عشب لا شيء | 0% |
 الحشيش منخفض | 25% |
المصدر:
wetter.comتوصيات صحية
Enjoy outdoor activities |
Open your windows to bring clean, fresh air indoors Get a monitor |
حبوب اللقاح
ما هو عدد حبوب اللقاح في San Leandro اليوم؟
المؤشر
منخفض
شجرة لا شيء | 0% |
عشب لا شيء | 0% |
الحشيش منخفض | 25% |
المصدر:
wetter.comاحمِ نفسك من تلوث الهواء في San Leandro
راقب الهواء الذي تتنفسه
احصل على قراءات دقيقة لجودة الهواء من AirVisual ورؤى في الوقت الفعلي للحصول على هواء أنظف. شاشات تكشف عن مصادر التلوث، وتسلط الضوء على وقت الحاجة إلى استخدام جهاز تنقية الهواء.
أجهزة تنقية هواء من الدرجة الطبية
تستخدم سلسلة HealthPro Series الموثوق بها في جميع أنحاء العالم تقنية HyperHEPA. تقوم بتصفية الجسيمات متناهية الصغر التي لا تلتقطها أجهزة تنقية الهواء الأخرى، مما يوفر حماية طبية من الدرجة الأولى.
أجهزة تنقية هواء قوية وأنيقة
تجمع سلسلة Atem Series، المدمجة والقوية، بين الهندسة السويسرية والأداء العالي لتنقية الهواء، وتصفية الجسيمات متناهية الصغر باستخدام تقنية HyperHEPA.
أكثر المواقع تلوثًا بالقرب من San Leandro
ترتيب AQI⁺ العالمي
ترتيب المحطات
ترتيب محطات AQI⁺ في الوقت الحقيقي للمحطات في San Leandro

ترتيب المدن
ترتيب المدن حسب مؤشر جودة الهواء AQI⁺ في الوقت الحقيقي في USA
جودة الهواء التاريخية بالقرب من San Leandro
التاريخ
الرسم البياني لجودة الهواء التاريخية لـ San Leandro
جودة الهواء التاريخية بالقرب من San Leandro
التاريخ
الرسم البياني لجودة الهواء التاريخية لـ San Leandro
مرافق الهواء النظيف
أكثر المواقع تلوثًا بالقرب من San Leandro
ترتيب AQI⁺ العالميترتيب المحطات
ترتيب محطات AQI⁺ في الوقت الحقيقي للمحطات في San Leandro
ترتيب المدن
ترتيب المدن حسب مؤشر جودة الهواء AQI⁺ في الوقت الحقيقي في USA



Measure your own air quality
Get a monitor and contribute air quality data in your city.


تعرّف على المزيد حول تلوث الهواء في San Leandro
ما هي جودة الهواء الحالية في San Leandro؟
جودة الهواء الحالية في San Leandro تُعدّ جيدة. الهواء نظيف ويُشكّل خطراً ضئيلاً أو معدوماً على الصحة.
How is the air quality in San Leandro, CA?
San Leandro is located in Alameda County in Northern California. This relatively large suburban city of just under 90,000 sits across the bay from San Francisco, just southeast of Oakland and roughly 34 miles north of San Jose. The local climate is heavily influenced by the San Francisco Bay, as San Leandro sits on the bay’s eastern shore. San Leandro air quality tends to mirror that of Castro Valley and Oakland, two neighboring towns. In 2019, these two neighbors averaged 7.1 μg/m3 and 7 μg/m3, respectively, for concentrations of PM2.5 (tiny particle pollutants measuring 2.5 micrometers or less), with a monthly high in November that more than doubled to 15.8 μg/m3 and 15.5 μg/m3, respectively.
To help predict how polluted San Leandro air is today, or on a typical day, the air quality rankings published by the American Lung Association (ALA) provide insight. The ALA’s State of the Air report card compares hundreds of cities to determine which have the best and worst air quality in the USA, compiling metrics for ozone pollution, 24-hour particle pollution, and annual particle pollution.
In 2018, the State of the Air report found that air quality in the Bay Area was poor, especially when it comes to ozone pollution.1 Specifically, the region encompassing San Jose, Oakland, and San Francisco ranked 13th for ozone pollution (magnified by hotter temperatures during the summer and early fall), 6th for short-term particle pollution (caused by car emissions, fireplace smoke, and wildfires), and 10th for annual particle pollution. Of the nine counties that make up the affluent area between San Francisco and San Jose, three of them (Alameda County, where San Leandro is located, in addition to Contra Costa County and Santa Clara County) earned a failing grade for short-term ozone and particle pollution over a three-year period (2014 to 2016). Overall, the Bay Area was found to have the sixth worst air quality in the United States, ranking in the top ten for two of these pollution categories, with significant negative impacts on health.2
Turning to 2020, air quality worsened. The State of the Air report revealed that the San Jose-San Francisco-Oakland area of California ranked 8th for high ozone days out of 228 metropolitan areas, 3rd out of 217 for 24-hour particle pollution, and 5th out of 203 for annual particle pollution.
It’s evident that a good portion of the Bay Area, including San Leandro, ranks among the most polluted regions in the US, with air quality along three key metrics getting worse during the 2018-2020 period when compared to other metropolitan areas across the country, illustrating that San Leandro air quality can be unhealthy on many days of the year. People who are sensitive to airborne pollutants are advised to check the air quality in San Leandro before venturing outside, especially during warmer months when increased sunlight and heat are more likely to cause ground-level ozone to form.
Note that, while the pollution rankings for the Bay Area are concerning, a majority of days are considered healthy. Favorable wind conditions and frequent rainfall, especially in the colder months of the year, often help mitigate air pollution in San Leandro.
What causes air pollution in San Leandro?
With the Bay Area ranked in the top ten for three key pollution measures, the likelihood of people experiencing unhealthy levels of air pollution in San Leandro and surrounding towns is relatively high.
One major cause of San Leandro air pollution is automobile emissions. Daily traffic in and around San Leandro tends to be heavy due to a major transportation network that serves the city (including the Interstate 880, 580, and 238 freeways) and connects San Francisco and San Jose, two of the most densely populated cities in the United States.3 Since San Leandro is situated directly between these two cities, it experiences the negative effects of this traffic.
When nitrogen Oxides (NOx) and volatile organic compounds (VOCs) emissions released by automobiles react in the presence of intense sunlight and heat, they form a secondary air pollutant: ozone. The hotter temperatures that cause this reaction occur more often during the months from April to October.4 The climate in and around San Leandro is ideal for ozone accumulation, especially during summertime when there’s less wind and rain to disperse and neutralize harmful airborne pollutants.
Wood burning can also contribute to reduced air quality for San Leandro and surrounding cities. The smoke from burning wood is a well-known cause of air pollution in the Bay Area, which becomes more prominent during the colder months of winter and early spring when more homes burn wood in fireplaces to generate heat.
Wildfires are a prominent natural cause airborne pollutants in San Leandro. Although unpredictable and short-lived, wildfires are often to blame for San Leandro’s most severe episodes of air pollution.
How have wildfires affected San Leandro air quality?
Wildfires in Northern California typically occur during the months of summer and early fall when warmer, drier conditions increase the likelihood of fires to ignite and spread. San Lendro residents, like others living in the Bay Area, must not only confront property damage caused by wildfires but also must endure spikes in harmful air pollution from wildfire smoke. During these events, air quality regulatory bodies may announce Spare the Air alerts and recommend that residents avoid outdoor activity.5
The bottom line is that days or even weeks of unhealthy or dangerous air quality are often the result of wildfires burning in Northern California. When multiple wildfires burn at the same time, negative effects are compounded and the decline in air quality becomes even more pronounced. As climate change increases the likelihood of large and severe wildfires, smoke may travel farther and negatively impact air quality in San Leandro even when that fire is not adjacent to the city.
When will the smoke in San Leandro clear?
When one or more wildfires are burning in Northern California, weather conditions play a major role in determining how quickly smoke will clear from San Leandro and other cities within the Bay Area.
When summer months bring more heat, gentler winds, and less rain, more wildfires occur and smoke tends to clear more slowly. As the months get colder, these weather conditions reverse, with fires less likely to start and smoke more likely to clear as a result of humidity and rain.
While fire containment is a major step towards putting out fires and eliminating smoke emissions, it is not an immediate solution for clean air. Some parts of a fire may still burn and produce smoke. Harmful smoke may last longer than the fire, potentially lingering for days, weeks, or even months after the fire is fully contained. Substantial air quality improvements typically come when fires are fully extinguished or when weather conditions, such as wind, are favorable.6
Another factor to consider is San Leandro’s unique geography, which plays a major role in how quickly smoke clears after wildfires occur in the region.
On one hand, smoke from fires may become trapped by the San Leandro Hills northeast of the city. On the other hand, San Leandro’s location near the San Francisco Bay often contributes to favorable weather conditions for dispersing emissions.
Rain in the Bay Area is a relatively common occurrence, especially in colder months. Falling rain can attract anywhere from hundreds to thousands of tiny airborne particulates and gas particles in a process called coagulation. The effect of rain on air quality is more pronounced with heavier rains and more effective on larger particulate matter, such as PM10, than on smaller airborne particles like PM2.5.7
Fast-moving winds, especially winds blowing in from the San Francisco Bay, help disperse pollutants. Winds are often the single most important weather condition for alleviating high pollution levels. The relationship between wind and wildfire smoke risks, however, is complex. Greater winds tend to result in smoke mixing with greater volumes of air, which reduces the concentration of smoke and therefore mitigates its harmful effects. But strong winds, such as the Bay Area’s Diablo winds, can contribute to starting more fires and spreading them faster, potentially resulting in a greater number of fires over a wider area and more smoke as a result.
At the top of this page is data describing how healthy the air quality in San Leandro is currently under “Forecast”, where the San Leandro air quality index (AQI) for today as well as for the rest of this week is listed.
What is the Bay Area doing to improve air quality?
Local governments in San Leandro and nearby cities as well as California state leaders have taken steps to address air quality problems in the Bay Area.
On a local level, the Bay Area Air Quality Management District (BAAQMD) has implemented a number of programs to reduce air pollution. For example, the Air District toughened the Wood Burning Rule in 2019 to increase protection against the harmful health effects caused by wood smoke. Under the amended rule, burning wood, manufactured firelogs, pellets, or solid fuel is illegal when a Spare the Air alert ― Burn Ban is in effect. Spare the Air alerts are announced whenever particulate pollution reaches unhealthy levels. Those who do not comply with the amended Rule face fines.8
Another action taken to address airborne pollution on a statewide level came when California Governor Gavin Newsom ordered the Air Resources Board to phase out sales of new gas-powered cars and some freight trucks by 2035, with medium and heavy-duty trucks to follow a decade later. The goal is to increase the number of vehicles that run on cleaner power, such as fuel cells and electric batteries, and gradually eliminate gas-powered vehicles from California roads.9 This may eventually reduce emissions from traffic that cause a high percentage of the Bay Area’s airborne pollutants, but there is some debate over how quickly this directive will affect the number of polluting cars already on the road and thus how much impact this measure will have on air quality in the short term.
+ Article Resources
[1] American Lung Association. (2020). State of the Air – report.
[2] Intarasuwan K, et al. (2018, April 18). Bay Area among most polluted regions in the nation: Report. NBC Bay Area.
[3] Metropolitan Transportation Commission (2020). Bay Area – population. Vital Signs.
[4] Bay Area Air Quality Management District. (2020). Spare the Air.
[5] Thadani T. (2020, September 29). Bay Area choked by wildfire smoke: Spare the Air runs through Friday. San Francisco Chronicle.
[6] Echeverria D. (2020, September 2). Smoke could linger over Bay Area for months, even after fires are contained. San Francisco Chronicle.
[7] Becerra LCB, et al. (2015, December). Influence of precipitation scavenging on the PM2.5/PM10 ratio at the Kennedy locality of Bogotá, Colombia. DOI: 10.17533/udea.redin.n76a07.
[8] Bay Area Air Quality Management District. (2020). An overview of the wood burning rule in the Bay Area.
[9] Becker R. (2020, September 23). Newsom orders ban of new gas-powered cars by 2035. Cal Matters.


