Get a monitor and contributor to air quality data in your city.

2.4K people follow this city


AIR QUALITY DATA CONTRIBUTORS
5 Contributors
See all

| Index | Low | ||
| Tree pollen | Low | ||
| Grass pollen | None | ||
| Weed pollen | None |

| Weather | Broken clouds |
| Temperature | 66.2°F |
| Humidity | 84% |
| Wind | 4.6 mp/h |
| Pressure | 29.7 Hg |
| # | city | US AQI |
|---|---|---|
| 1 |  Mecca, California Mecca, California | 181 |
| 2 | Thermal, California | 151 |
| 3 | Coachella, California | 149 |
| 4 | Apple Valley, Minnesota | 91 |
| 5 | Palm Desert, California | 89 |
| 6 | Oklahoma City, Oklahoma | 88 |
| 7 | Tulsa, Oklahoma | 88 |
| 8 | Fort Thompson, South Dakota | 82 |
| 9 | Wichita, Kansas | 80 |
| 10 | Edmond, Oklahoma | 79 |
(local time)
SEE WORLD AQI RANKING
| # | station | US AQI |
|---|---|---|
| 1 | Maple Lane - AirVisual | 56 |
| 2 | Rock Bay Drive | 53 |
| 3 | Clifton Heights | 48 |
| 4 | Carrithers Middle School | 34 |
| 5 | Cannons Lane | 33 |
| 6 | Firearms Training | 32 |
| 7 | Watson Lane Elementary School, Valley Station | 31 |
| 8 | Durrett Lane Near Road Site | 29 |
| 9 | 110 State St | 21 |
(local time)
SEE WORLD AQI RANKING
US AQI
33
live AQI index
Good

| Air pollution level | Air quality index | Main pollutant |
|---|---|---|
| Good | 33 US AQI | PM2.5 |
| Pollutants | Concentration | |
|---|---|---|
| PM2.5 | 6µg/m³ | |
| PM10 | 14µg/m³ | |
| O3 | 55µg/m³ | |
| NO2 | 27.7µg/m³ | |
| SO2 | 2.6µg/m³ | |
| CO | 286.3µg/m³ | |
PM2.5
x1.2
PM2.5 concentration in Louisville is currently 1.2 times the WHO annual air quality guideline value
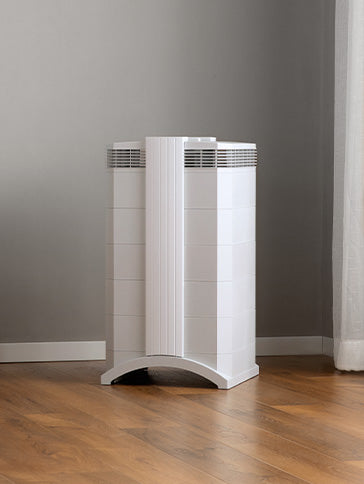
 | Enjoy outdoor activities |
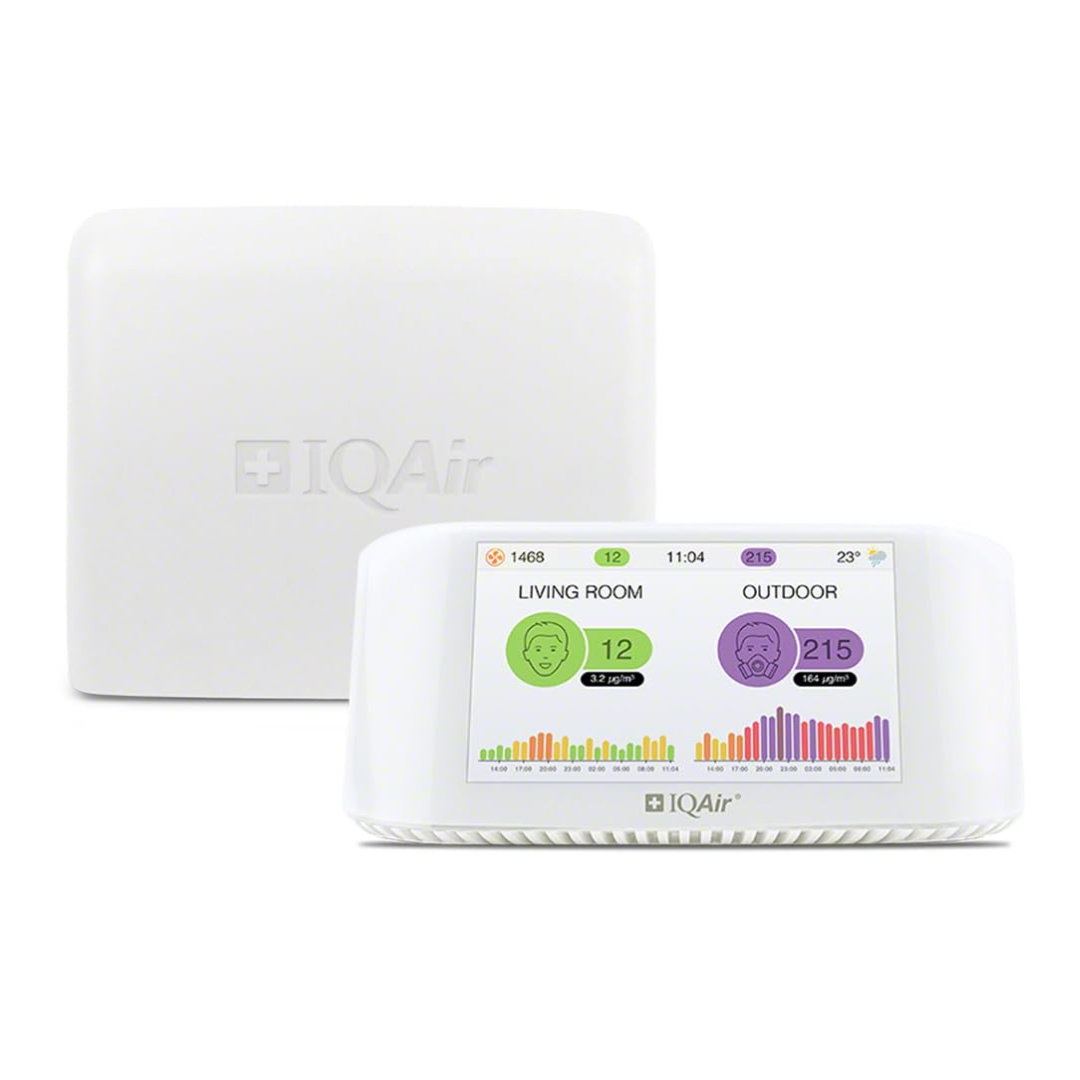
 | Open your windows to bring clean, fresh air indoors GET A MONITOR |
| Day | Pollution level | Weather | Temperature | Wind |
|---|---|---|---|---|
| Sunday, May 12 | Moderate 52 AQI US  | 75.2° 55.4° | ||
| Monday, May 13 | Good 35 AQI US | 71.6° 59° | ||
| Tuesday, May 14 | Good 28 AQI US | 69.8° 57.2° | ||
| Today | Good 33 AQI US | 69.8° 57.2° | ||
| Thursday, May 16 | Moderate 56 AQI US | 75.2° 55.4° | ||
| Friday, May 17 | Moderate 61 AQI US | 69.8° 60.8° | ||
| Saturday, May 18 | Moderate 61 AQI US | 73.4° 60.8° | ||
| Sunday, May 19 | Moderate 63 AQI US | 77° 60.8° | ||
| Monday, May 20 | Moderate 74 AQI US | 80.6° 60.8° | ||
| Tuesday, May 21 | Moderate 77 AQI US | 84.2° 62.6° |
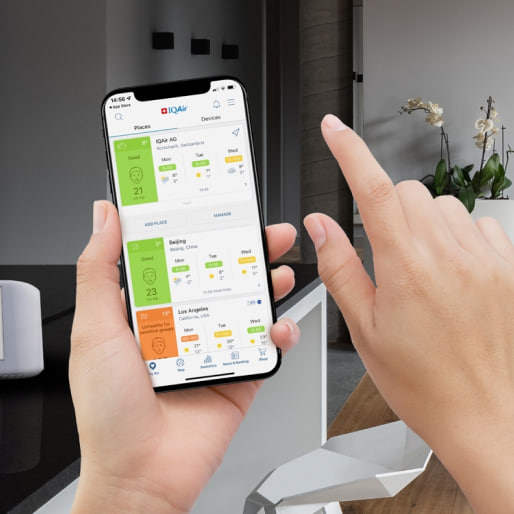
Interested in hourly forecast? Get the app
News
The latest air quality news and resources.
Louisville is the largest city in the State of Kentucky. It was named after King Louis XVI of France. It was founded in 1778 by George Clark which makes it one of the oldest cities west of the Appalachian Mountains. The 2019 population level of the metropolis was 1.2 million people. Its exponential growth was due to its position on the Ohio River. It is situated at the main obstacle to through river traffic which is a set of rapids that are un-navigable. As a consequence boats had to be taken out of the water and man-handled around the rapids until they could safely be relaunched.
At the beginning of 2021, Louisville was experiencing a period of “Moderate” air quality with a US AQI figure of 52. This classification is in accordance with recommended levels from the World Health Organisation (WHO). The recorded levels of the various pollutants were as follows: PM2.5 - 12.8 µg/m³, PM10 - 27.1 µg/m³, ozone (O3) - 3 µg/m³, nitrogen dioxide (NO2) - 59.8 µg/m³, sulphur dioxide (SO2) - 0.8 µg/m³ and carbon monoxide (CO) - 692.7 µg/m³.
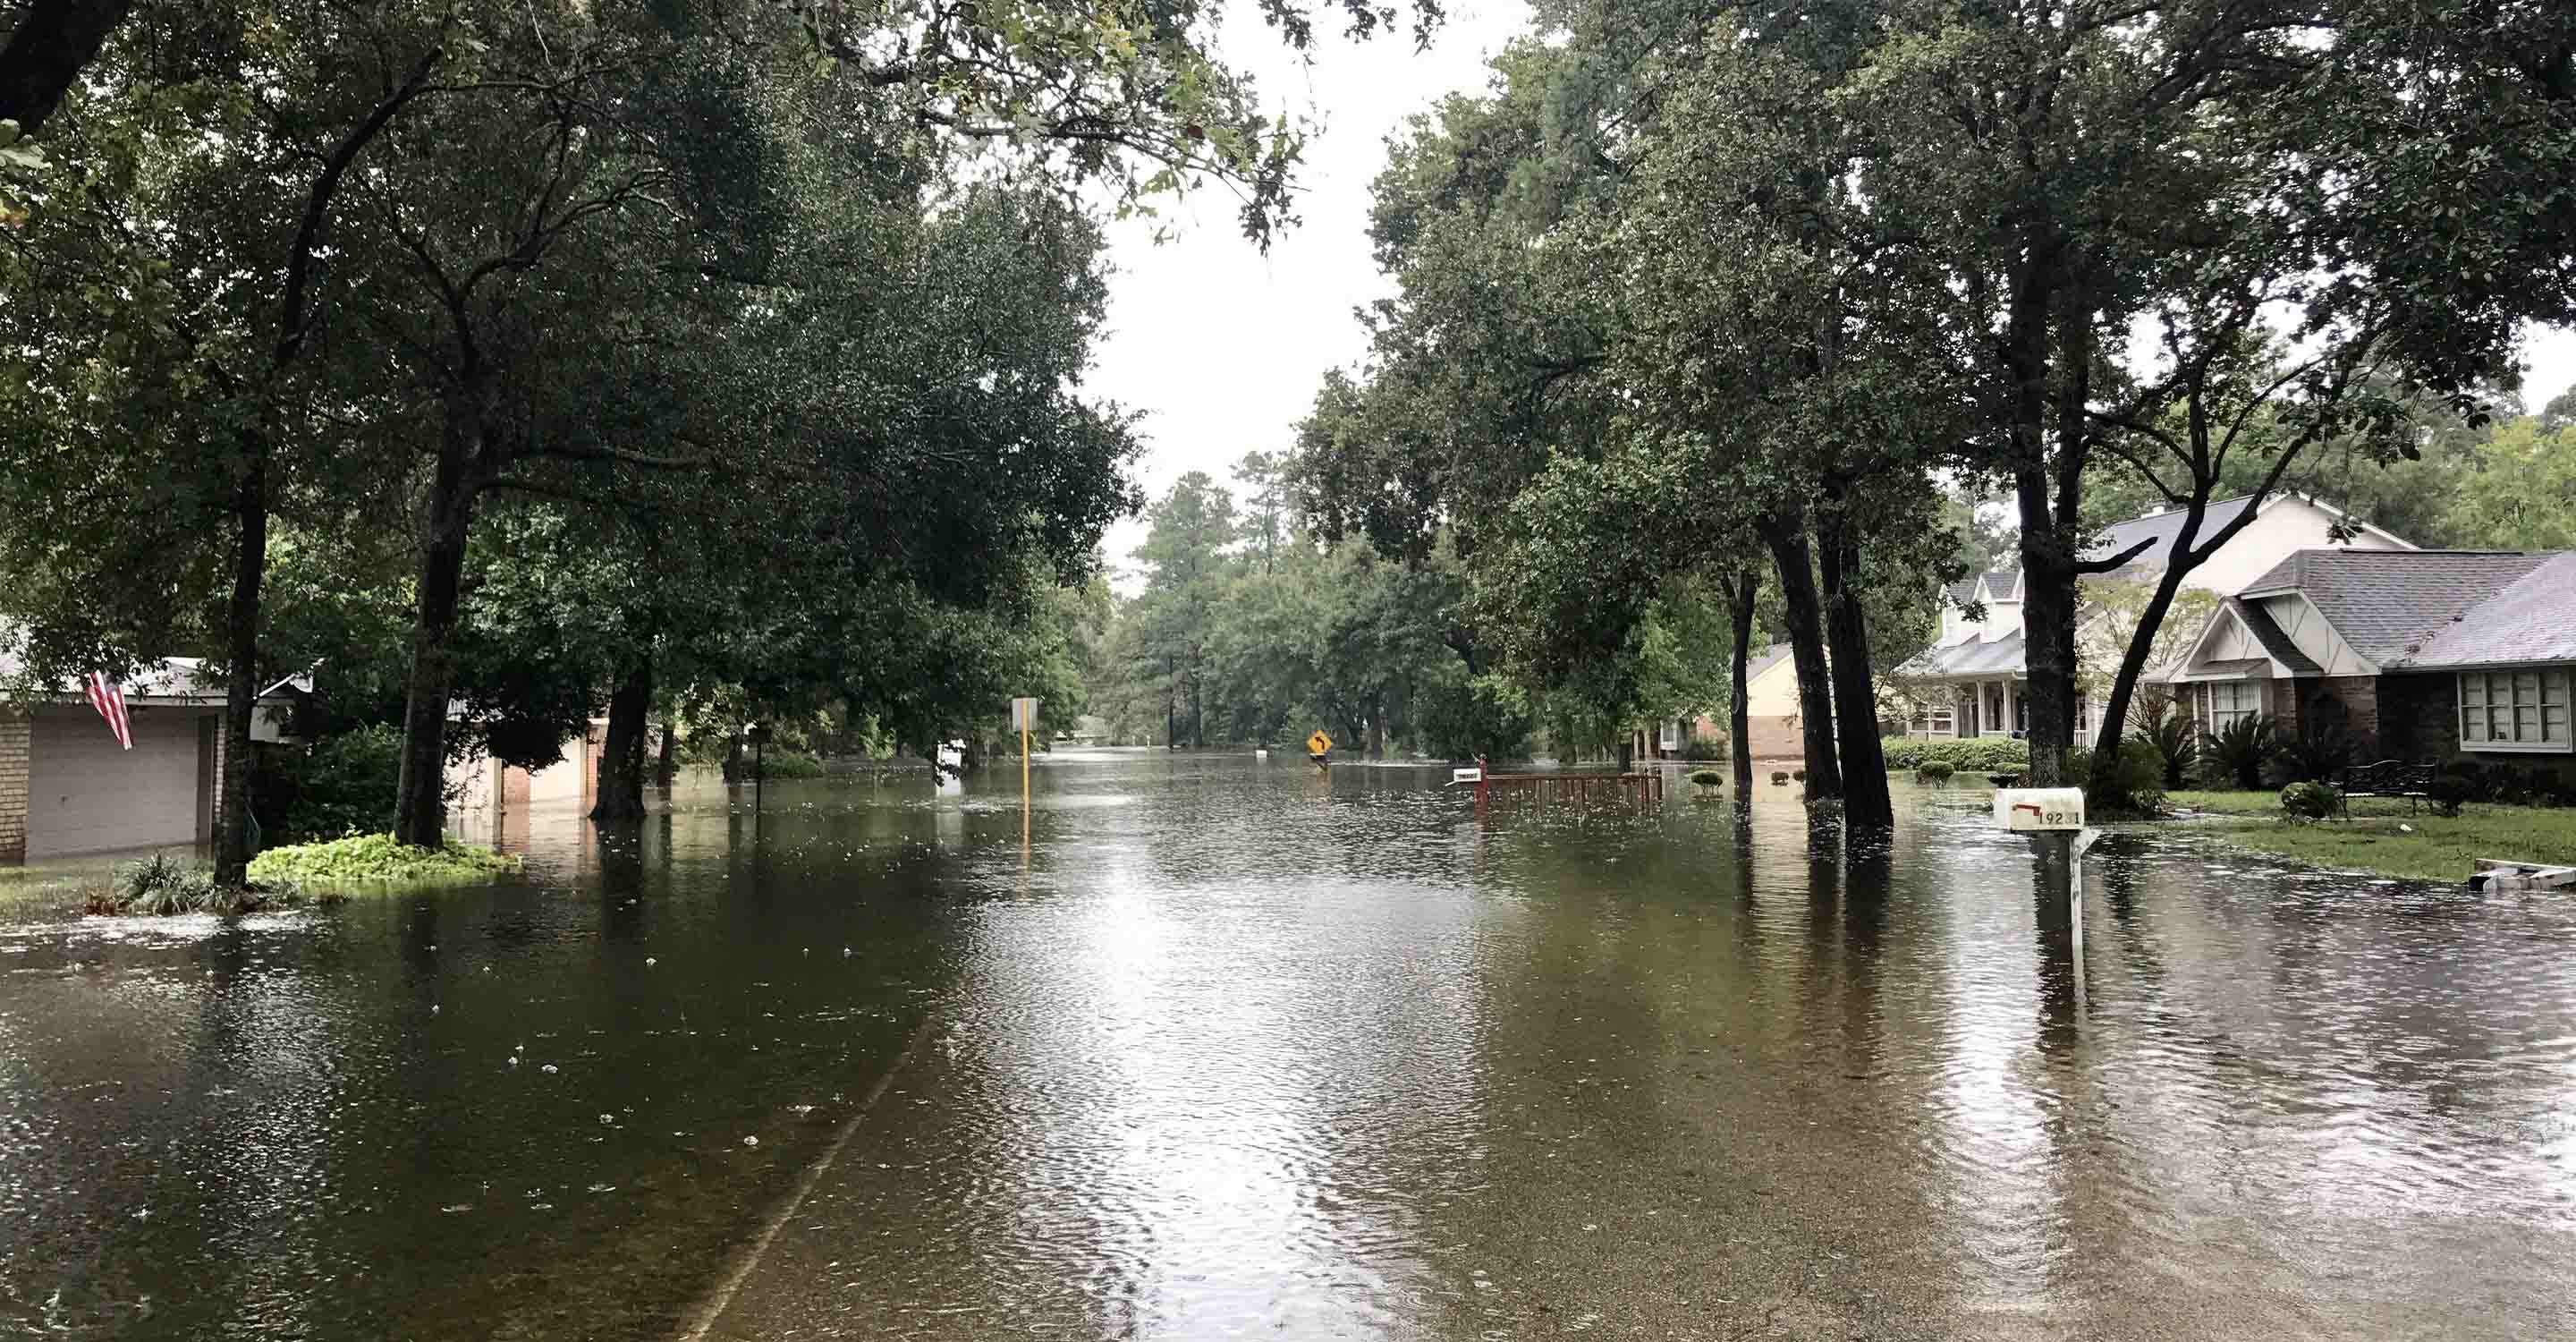
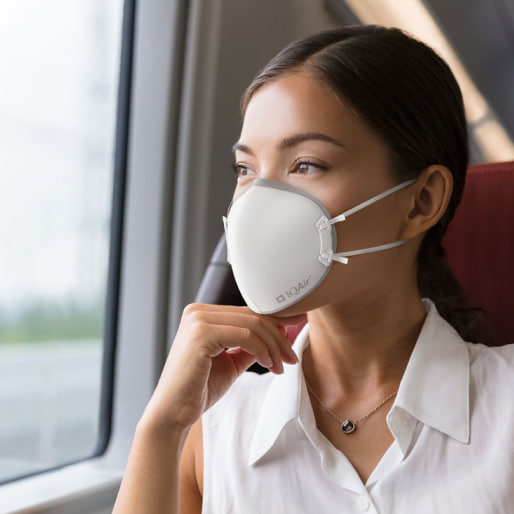
With a level as high as this, the advice would be to close all doors and windows to prevent the ingress of dirty air inside the rooms. Those of a sensitive disposition should avoid venturing outside until the air quality improves. If going out is unavoidable, then a good quality mask should be worn at all times.
Looking back at the 2020 figures from the IQAir website, it can be seen that Louisville achieved the WHO target goal of less than 10 µg/m³ for ten months from January until the end of October. For the remaining two months, November was classed as “Good” with a figure of 10.8 µg/m³ and December recorded 12.2 µg/m³ which classified it as being “Moderate” with readings between 12.1 and 35.4 µg/m³.
In 2019, the figures showed that Louisville achieved the WHO target goal of less than 10 µg/m³ for six months, April through June and August through October. For the remaining six months the figure was recorded as being “Good” with figures between 10 and 12 µg/m³.
Looking back even further, it can be seen that the air quality is becoming slightly worse. In 2017 the annual mean figure was 8.8 µg/m³, in 2018 it was 9.4 µg/m³ and in 2019 it was 9.7 µg/m³. All figures are within the goals set by the WHO of being less than 10 µg/m³.
The American Lung Association ranked the region around Louisville 21st out of the nation’s 25 most polluted cities for year-round particle pollution. This particular study looked at figures from between 2014 and 2016, in particular the levels of pollution from vehicle exhausts, dust and soot.
Despite the ranking, the air quality in Louisville is getting better on an annual basis. Data from the US Environmental Protection Agency shows that the area around Louisville has steadily reduced the number of fine particles PM2.5 and PM10 floating around in the air.
Ozone (O3) is another recurring pollutant that can be extremely dangerous to human health.
Human-generated (also called "anthropogenic") sources of air pollution can be broken down into two categories: Mobile and stationary.
Mobile sources of air pollution include most forms of on-road transportation vehicles such as automobiles and trucks, as well as non-road equipment like tractors, ships, trains, and aeroplanes.
Stationary sources of air pollution are sources of emissions that have specific locations and release pollutants in quantities above a certain emission threshold. These sources include large factories and electric power plants.
Louisville’s toxic air pollution has got better over the years, but problems still remain. More than 80 per cent of the toxic air pollution released in 2017 was in the western and southern areas of the city.
Currently, people living near toxic air polluters are nearly twice as likely to be those that live in poverty.
The University of Louisville is working on a scientific experiment that will plant trees in a neighbourhood in Louisville to study how they impact heart health, diabetes and obesity. This follows on from the fact that people who live in areas of denser greenery have lower levels of stress and generally have healthier hearts.
Many of the large industrial facilities are actively reducing their emissions of toxic chemicals. The American Synthetic Rubber Company had reduced emissions of the carcinogenic chemical 1,3 butadiene by over 90 per cent since 2003. Another company is working hard to reduce the amount of chromium it releases as an emission; ideally, they would like to remove it completely.
In 2015 it was found that over 1,000 residents were suffering from asthma. Air Louisville enrolled them in their programme to assist them in determining the whereabouts of the most polluted areas in the city. Each participant was given a device that attached to their inhaler and sent back data as to when it was operated and for how long. After correlating all the collected data they were able to pin-point the worst areas in the city for polluted air. By targeting specific locations with poor air quality, they were able to initiate a massive, city-wide effort to change policy, in addition to creating public awareness surrounding the issue.
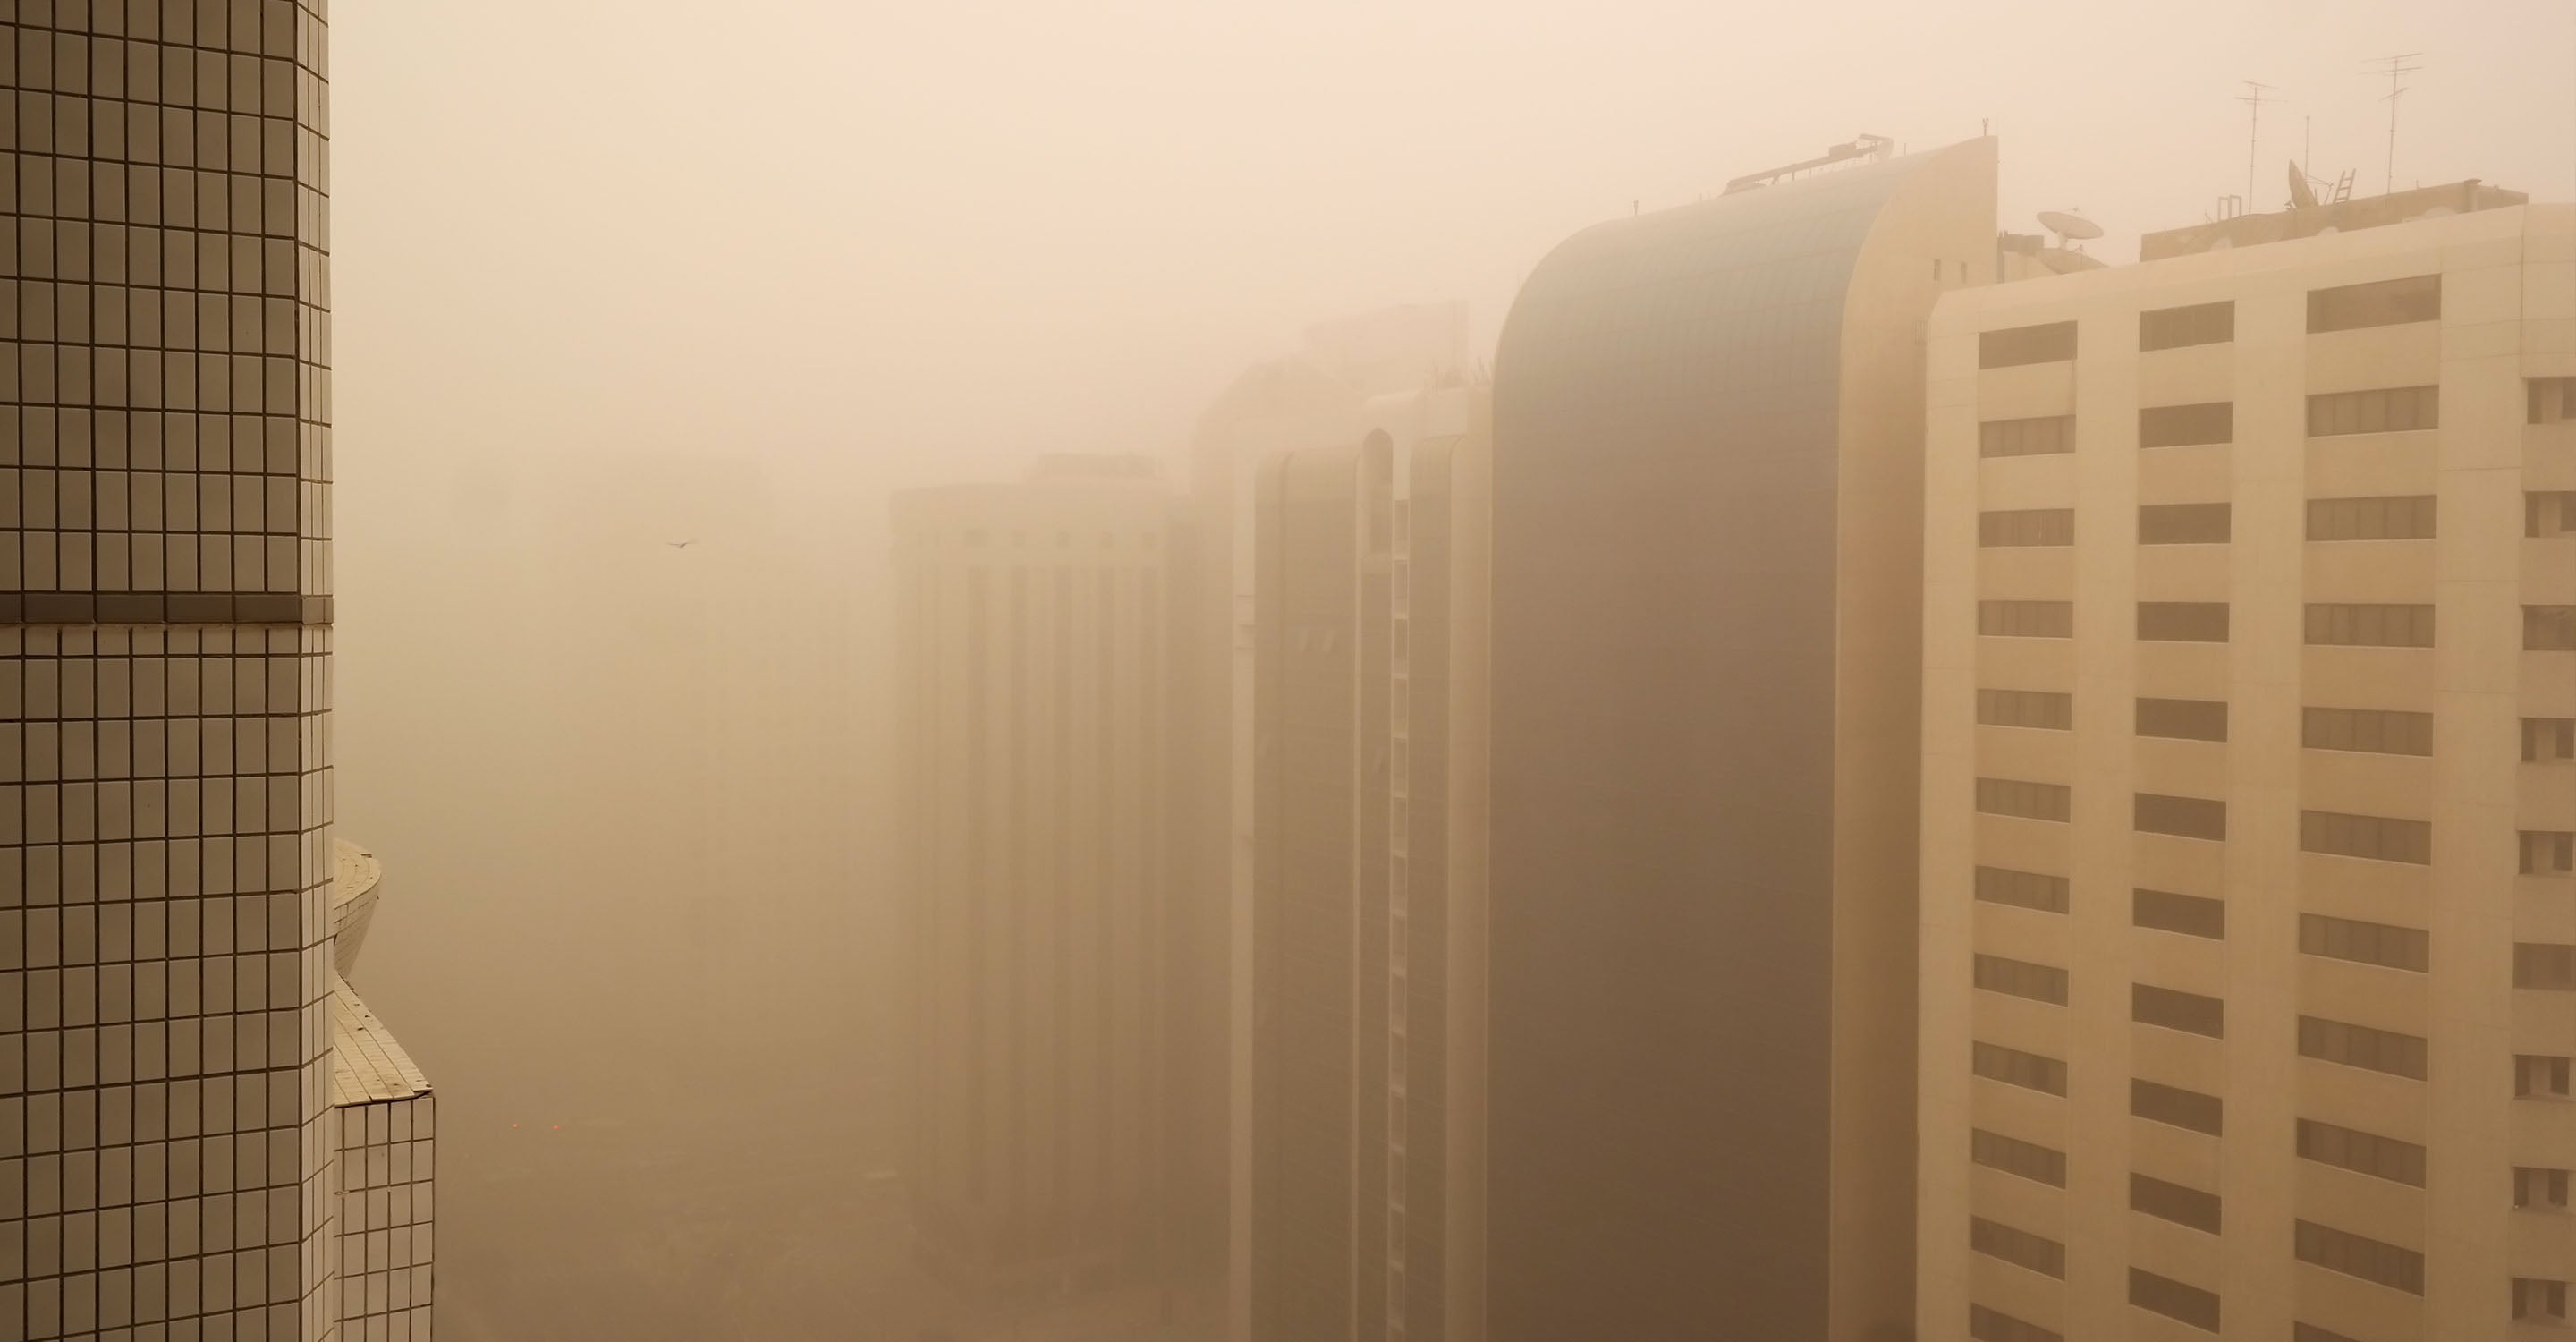
As the world gets hotter through climate change and more crowded, our fossil-fuelled engines continue to pump out dirty emissions, and half the world has no access to clean fuels or technologies (e.g. stoves, lamps), the very air we breathe is growing dangerously polluted: nine out of ten people now breathe polluted air, which kills 7 million people every year.
The health effects of air pollution are serious because one-third of deaths from stroke, lung cancer and heart disease are due to air pollution. This is having an equivalent effect to that of smoking tobacco, and much higher than, say, the effects of eating too much salt.
Air pollution is impossible to escape from, no matter how rich an area you live in. It is all around us. Microscopic pollutants in the air can slip past our body’s defences, penetrating deep into our respiratory and circulatory system, damaging our lungs, heart and brain. The PM2.5 pollutants are microscopic in size and can easily transfer themselves into the bloodstream. Once inside, they have the ability to travel anywhere in the body.
5Contributors
Government Contributor
Individual Contributor
1 station
3 Anonymous Contributors
3 stations
 Data validated and calibrated by IQAir