Get a monitor and contributor to air quality data in your city.

2.6K people follow this city


AIR QUALITY DATA CONTRIBUTORS
4 Contributors

See all

| Index | Low | ||
| Tree pollen | Low | ||
| Grass pollen | Low | ||
| Weed pollen | None |

| Weather | Scattered clouds |
| Temperature | 86°F |
| Humidity | 24% |
| Wind | 5.7 mp/h |
| Pressure | 29.7 Hg |
| # | city | US AQI |
|---|---|---|
| 1 |  Maricopa, Arizona Maricopa, Arizona | 109 |
| 2 | Corpus Christi, Texas | 97 |
| 3 | Boerne, Texas | 92 |
| 4 | Mecca, California | 90 |
| 5 | San Antonio, Texas | 90 |
| 6 | New Braunfels, Texas | 89 |
| 7 | Casa Grande, Arizona | 84 |
| 8 | Terre Haute, Indiana | 81 |
| 9 | Austin, Texas | 77 |
| 10 | Shreveport, Louisiana | 74 |
(local time)
SEE WORLD AQI RANKING
| # | station | US AQI |
|---|---|---|
| 1 | LEHI | 68 |
| 2 | Falcon Field | 42 |
| 3 | Blue Point Sheriff | 38 |
| 4 | Mesa - Brooks Reservoir | 38 |
| 5 | Sunland Village | 35 |
| 6 | Las Sendas | 32 |
(local time)
SEE WORLD AQI RANKING

Spotlight
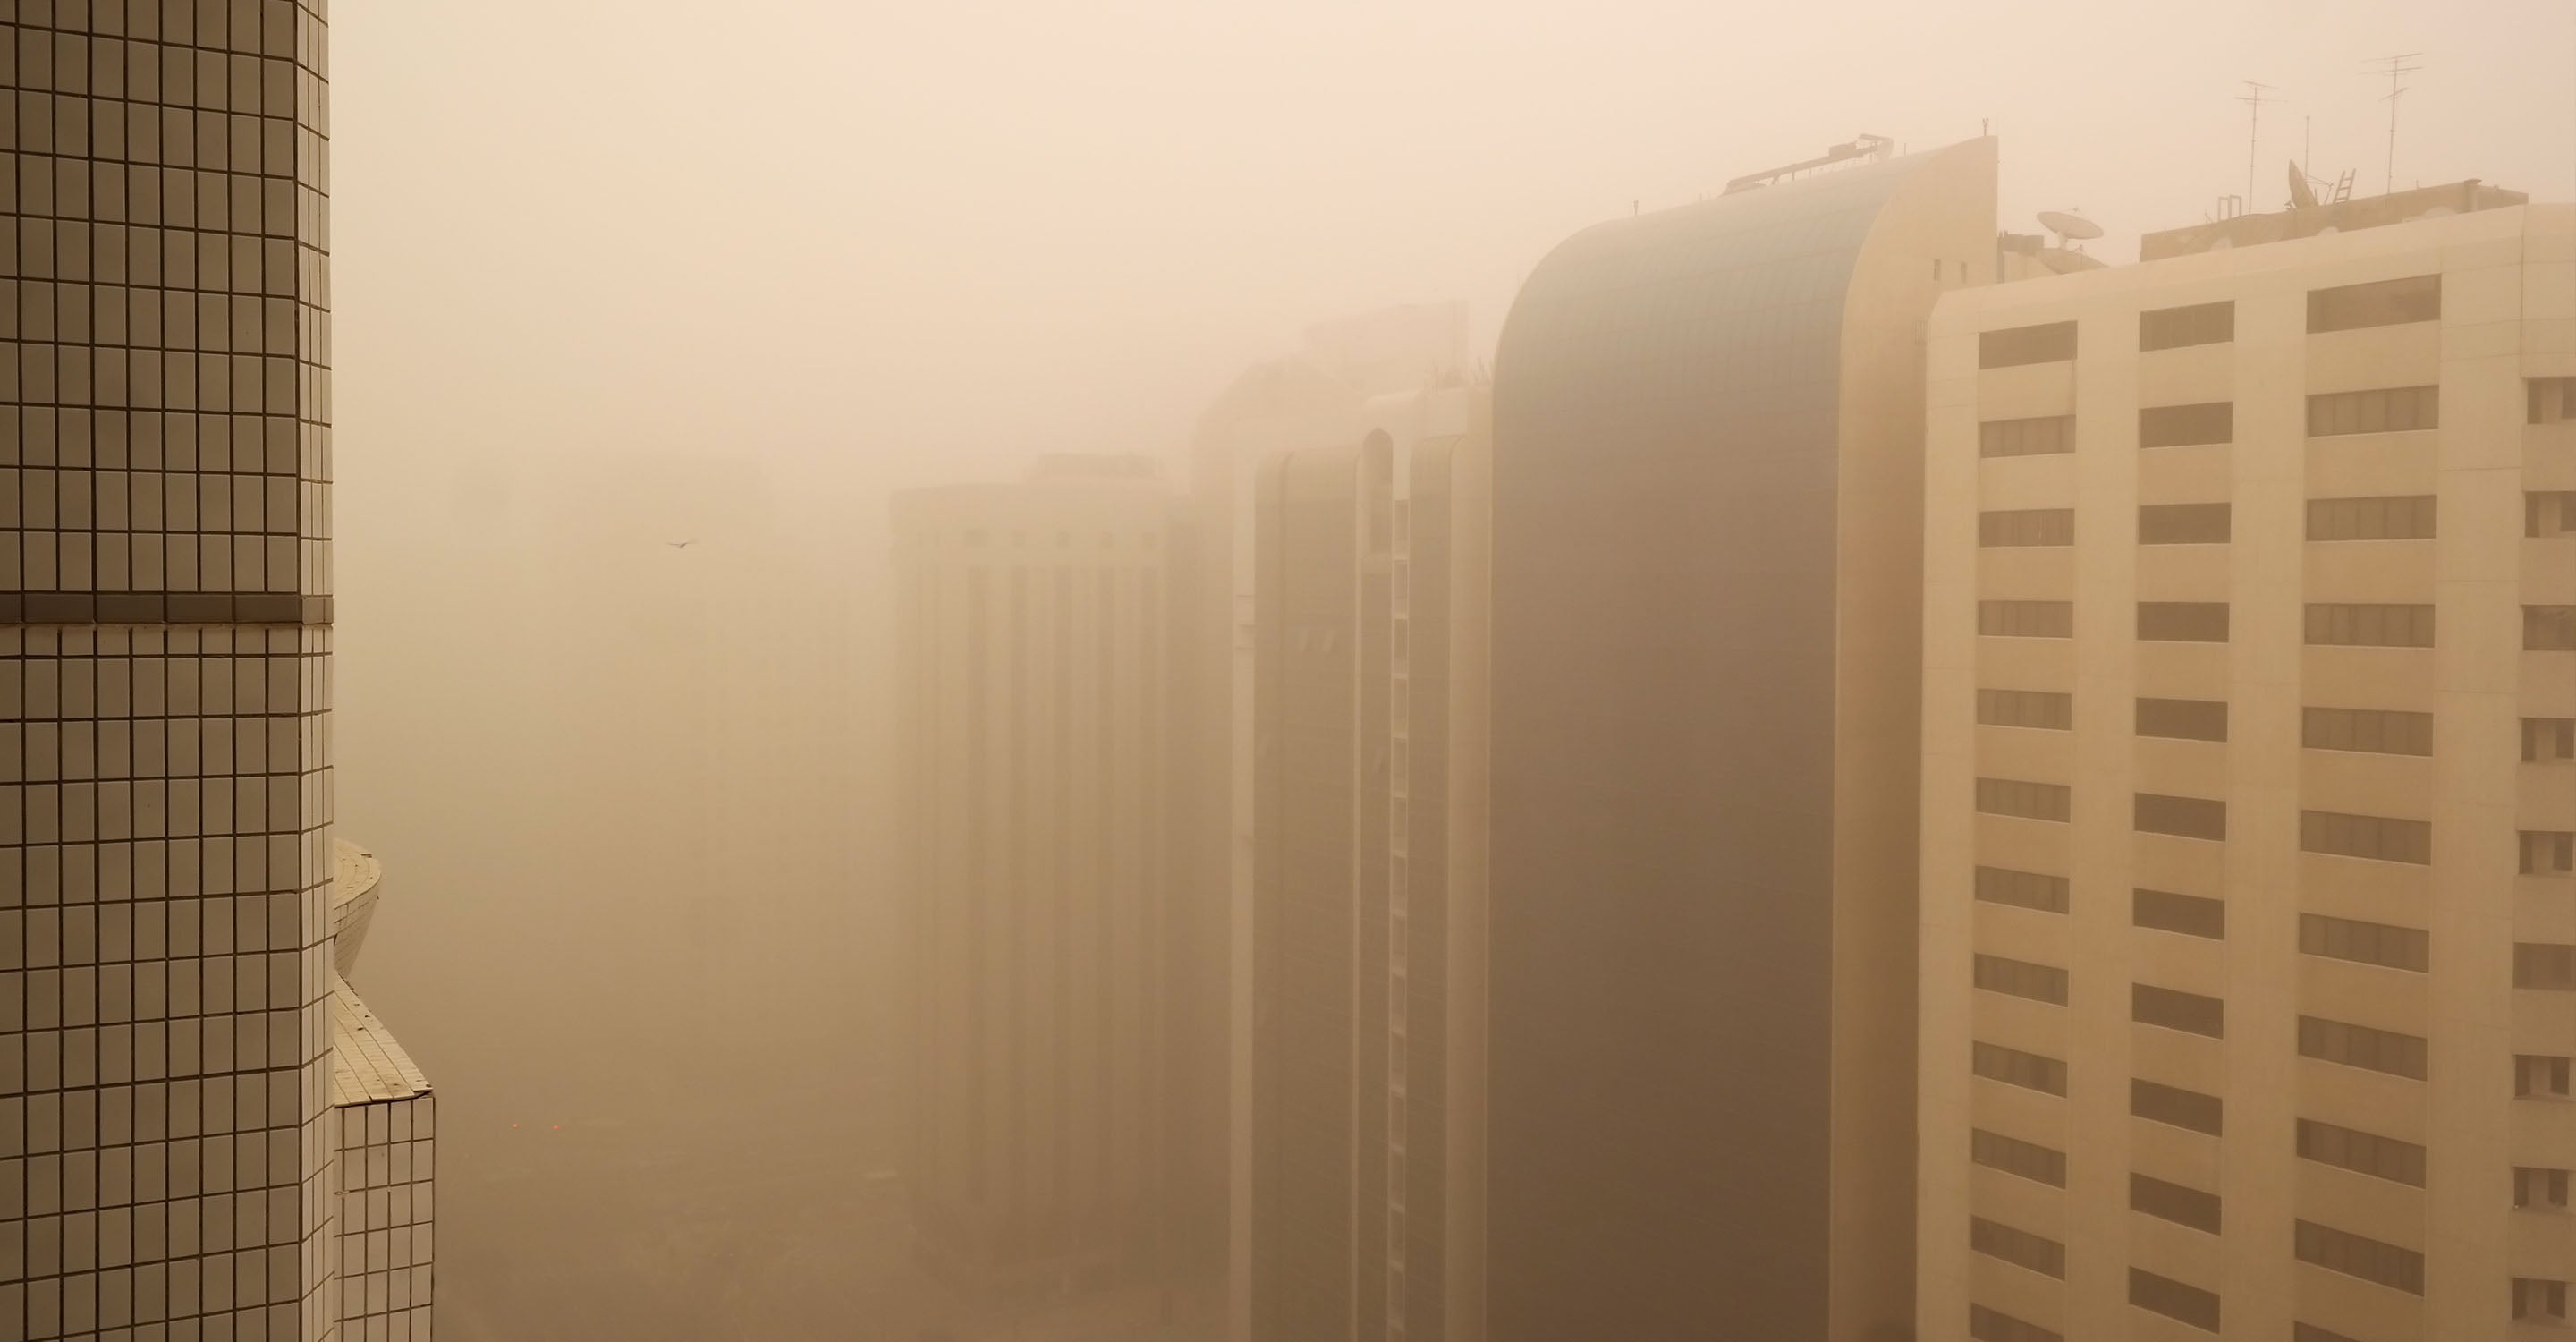
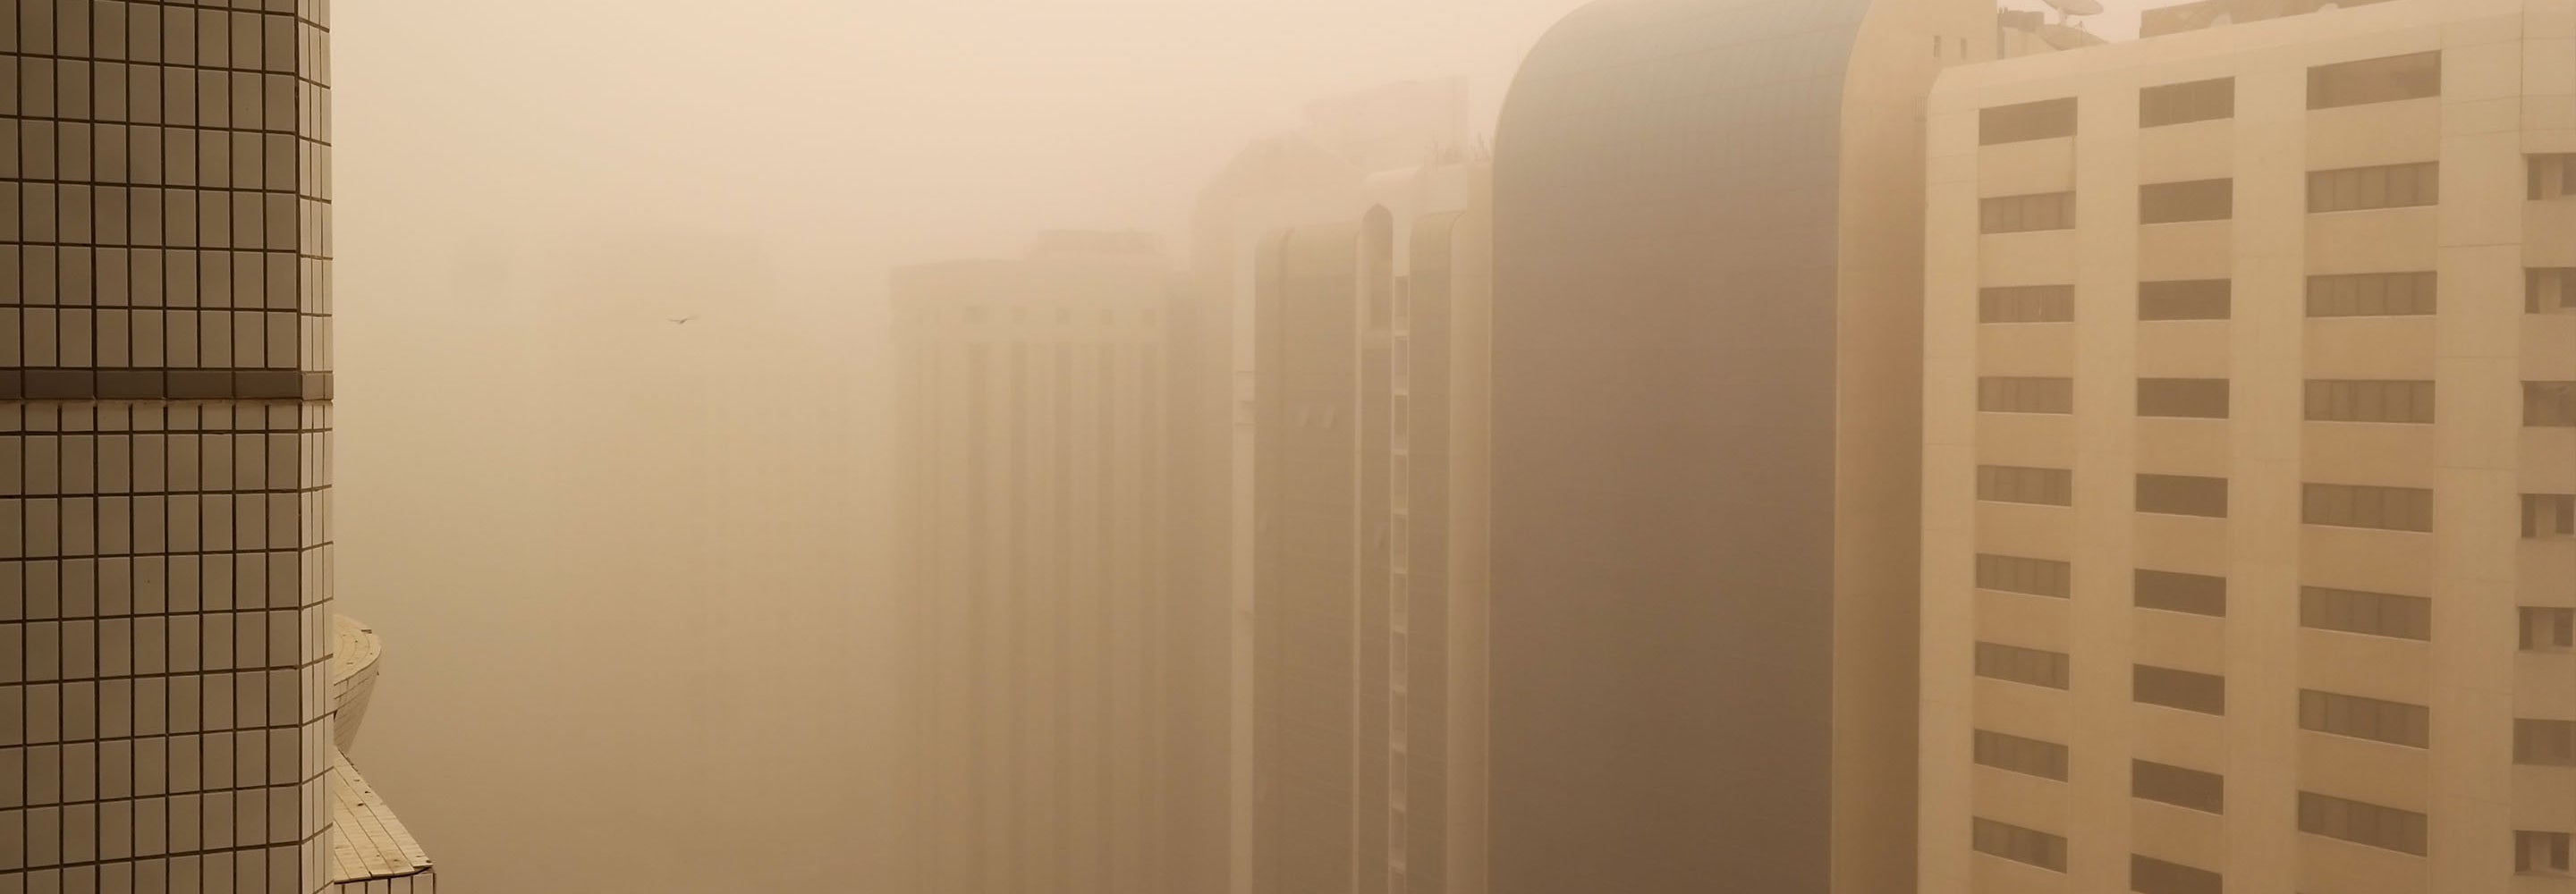
There is dust and sand blowing in Arizona. Protect yourself from dust and sand and follow health recommendations. Click here.
US AQI
37
live AQI index
Good

| Air pollution level | Air quality index | Main pollutant |
|---|---|---|
| Good | 37 US AQI | PM2.5 |
| Pollutants | Concentration | |
|---|---|---|
| PM2.5 | 6.7µg/m³ | |
| PM10 | 33.5µg/m³ | |
PM2.5
x1.3
PM2.5 concentration in Mesa is currently 1.3 times the WHO annual air quality guideline value
 | Enjoy outdoor activities |
 | Open your windows to bring clean, fresh air indoors GET A MONITOR |
| Day | Pollution level | Weather | Temperature | Wind |
|---|---|---|---|---|
| Monday, May 13 | Good 41 AQI US | 96.8° 73.4° | ||
| Tuesday, May 14 | Good 41 AQI US | 93.2° 73.4° | ||
| Wednesday, May 15 | Good 40 AQI US | 91.4° 71.6° | ||
| Today | Good 37 AQI US | 91.4° 71.6° | ||
| Friday, May 17 | Good 50 AQI US | 96.8° 73.4° | ||
| Saturday, May 18 | Good 50 AQI US | 98.6° 77° | ||
| Sunday, May 19 | Moderate 57 AQI US  | 93.2° 73.4° | ||
| Monday, May 20 | Good 48 AQI US | 91.4° 73.4° | ||
| Tuesday, May 21 | Moderate 64 AQI US | 89.6° 66.2° | ||
| Wednesday, May 22 | Moderate 77 AQI US | 93.2° 73.4° |
Interested in hourly forecast? Get the app
News
The latest air quality news and resources.
Mesa is a city located in the American state of Arizona, within Maricopa county. It is home to over 518 thousand people, making it the 3rd largest city in the State, and 35th throughout the whole of the U.S. Mesa has many higher education facilities, making it a draw for students both domestically and internationally, as well as having a large amount of employment in sectors such as healthcare. The service industry also has a big presence (with Walmart being one of the biggest employers), and Mesa is heavily involved in the manufacturing and construction of certain goods, including airplanes, missiles, satellites and other similar aviation or tech related products.
With the mass movement of people, as well as large scale import and exportation of industrial items and goods, there are sources of pollution that cause the air quality of Mesa to be affected somewhat. Despite this inevitable altering of the air quality, the city still manages to come in with a fairly respectable reading of pollution levels. In 2020, Mesa came in with a PM2.5 reading of 6.2 μg/m³, a very good number that placed Mesa within the World Health Organizations (WHO's) target goal of 10 μg/m³ or less, for the best quality air. Whilst there were several months where the PM2.5 count rose higher, it stands to reason that Mesa has a very good overall quality of air, despite a few polluting disturbances, which will be discussed in short.
Even with such a good quality of air throughout the year, with its reading of 6.2 μg/m³ placing it in 4311th place out of all cities ranked worldwide, there would still be inevitable sources of pollution, as is usual in all areas that have a high amount of anthropogenic and industrial activity.
The main causes would be ones such as the ever present use of vehicles throughout the city. Vehicular emissions are some of the most prevalent causes of ambient pollution worldwide, and in Mesa they still account for large amounts of pollution accumulations. Cars and other smaller vehicles can put out large amounts of chemical pollutants and dangerous particulate matter, particularly hazardous when these fumes accumulate in large amounts over areas that see a high volume of traffic (such as rush hour routes or other similar areas).
To compound this situation further, the use of heavy duty vehicles such as trucks, buses and lorries can add to the pollution levels further, often running on diesel fuels and putting out far more pollution than their smaller counterparts would. Tons of microscopic rubber particles can also accumulate over time due to the wearing of tire tread from excessive vehicular use, causing damage to both human health when respired, as well as the environment. Other prominent sources of pollution include ones such as emissions from factories and power plants (both of which often resort to using coal as one of their main fuel sources), as well as construction sites and road repairs, which can cause large amounts of fine particulate matter to be thrown into the air, as well as releasing heavy metals such as mercury or lead into the environment.
Observing the PM2.5 numbers collected over the course of 2020, it can be seen that there was a period of time in which the PM2.5 count rose higher than it was for the rest of the year. This occurred during the winter months, which is a common event to witness, due to the decrease in temperature leading to a higher demand for energy to provide heating to homes and businesses, and in rarer cases, people resorting to burning firewood (more common in rural areas typically).
The change can be seen from the months of November through to December, with October coming in with a PM2.5 reading of 7 μg/m³, which then rose up suddenly to 9.4 μg/m³ in November. These higher readings continued on into the early months of the next year, with January also presenting with an elevated reading of 8.1 μg/m³, before falling back down to more baseline levels and entering into a period of cleaner air. In closing, the months of December and January were amongst the most polluted over the course of 2020, with December having the highest reading of 9.4 μg/m³. Other months of note in regards to higher pollution levels were August and September, which presented with PM2.5 readings of 9.3 μg/m³ and 8.7 μg/m³
In following from the previous question, after the more polluted months there came a period of time in which the PM2.5 count was considerably lower, indicating a much better quality of air, free from accumulations of smoke, haze and other particulate matter such as PM2.5 and PM10.
PM2.5 refers to particulate matter that is 2.5 micrometers or less in diameter, often going down to sizes as small as 0.001 microns and beyond. This small size makes it extremely easy and dangerous to inhale, and as such it is used as a major component in the calculation of the overall AQI, or air quality index.
After January came to a close and the PM2.5 count dropped back down to 6.1 μg/m³ in February and then 3.4 μg/m³ in March, the following period of time between March all the way through to August was when the air quality in Mesa was at its cleanest, indicating a long period of time of great air quality, hence why the city placed well overall. Some of the cleanest months on record were March, April and May, with PM2.5 readings of 3.4 μg/m³, 3.6 μg/m³ and 3.9 μg/m³ respectively, indicating that the air would be free from accumulations of smoke, haze and many other air contaminants.
Whilst it maintains a great quality of air, Mesa would still have a wide variety of pollutants found in its air, just in lower quantities than other cities that see considerably higher PM2.5 readings. Some of these pollutants would include ones such as carbon monoxide (CO), nitrogen dioxide (NO2) and sulfur dioxide (SO2). Most of these can find their release from vehicles, with nitrogen dioxide being the biggest offender in vehicle exhaust fumes.
Ozone (O3) is another prominent pollutant that is of great concern throughout American cities. It is formed from the various oxides of nitrogen (NOx), as well as other gases and chemicals released from cars and other polluting sources being exposed to solar radiation. This causes ozone to be formed, and is particularly prominent during the summer months due to the abundance of sunlight. These are a few of the main chemicals found in the air in Mesa, with higher concentrations present during periods of higher pollution.
4Contributors
2 Government Contributors
3 stations
Individual Contributor
1 station
Anonymous Contributor
1 station
4 Data sources
 Data validated and calibrated by IQAir