Be the first to measure and contribute air quality data to your community

27.1K people follow this city


AIR QUALITY DATA SOURCE

| Weather | Clear sky |
| Temperature | 93.2°F |
| Humidity | 16% |
| Wind | 6.9 mp/h |
| Pressure | 29.7 Hg |
| # | city | US AQI |
|---|---|---|
| 1 |  Gharghoda, Chhattisgarh Gharghoda, Chhattisgarh | 123 |
| 2 | Delhi, Delhi | 119 |
| 3 | Jabalpur, Madhya Pradesh | 113 |
| 4 | Jaipur, Rajasthan | 98 |
| 5 | New Delhi, Delhi | 94 |
| 6 | Hyderabad, Telangana | 81 |
| 7 | Raipur, Chhattisgarh | 79 |
| 8 | Mumbai, Maharashtra | 77 |
| 9 | Hubli, Karnataka | 76 |
| 10 | Bengaluru, Karnataka | 70 |
(local time)
SEE WORLD AQI RANKING

US AQI
111*
live AQI index
Unhealthy for sensitive groups

| Air pollution level | Air quality index | Main pollutant |
|---|---|---|
| Unhealthy for sensitive groups | 111* US AQI | PM2.5 |
| Pollutants | Concentration | |
|---|---|---|
| PM2.5 | 39.8*µg/m³ | |
PM2.5
x8
PM2.5 concentration in Bhiwadi is currently 8 times the WHO annual air quality guideline value
 | Reduce outdoor exercise |
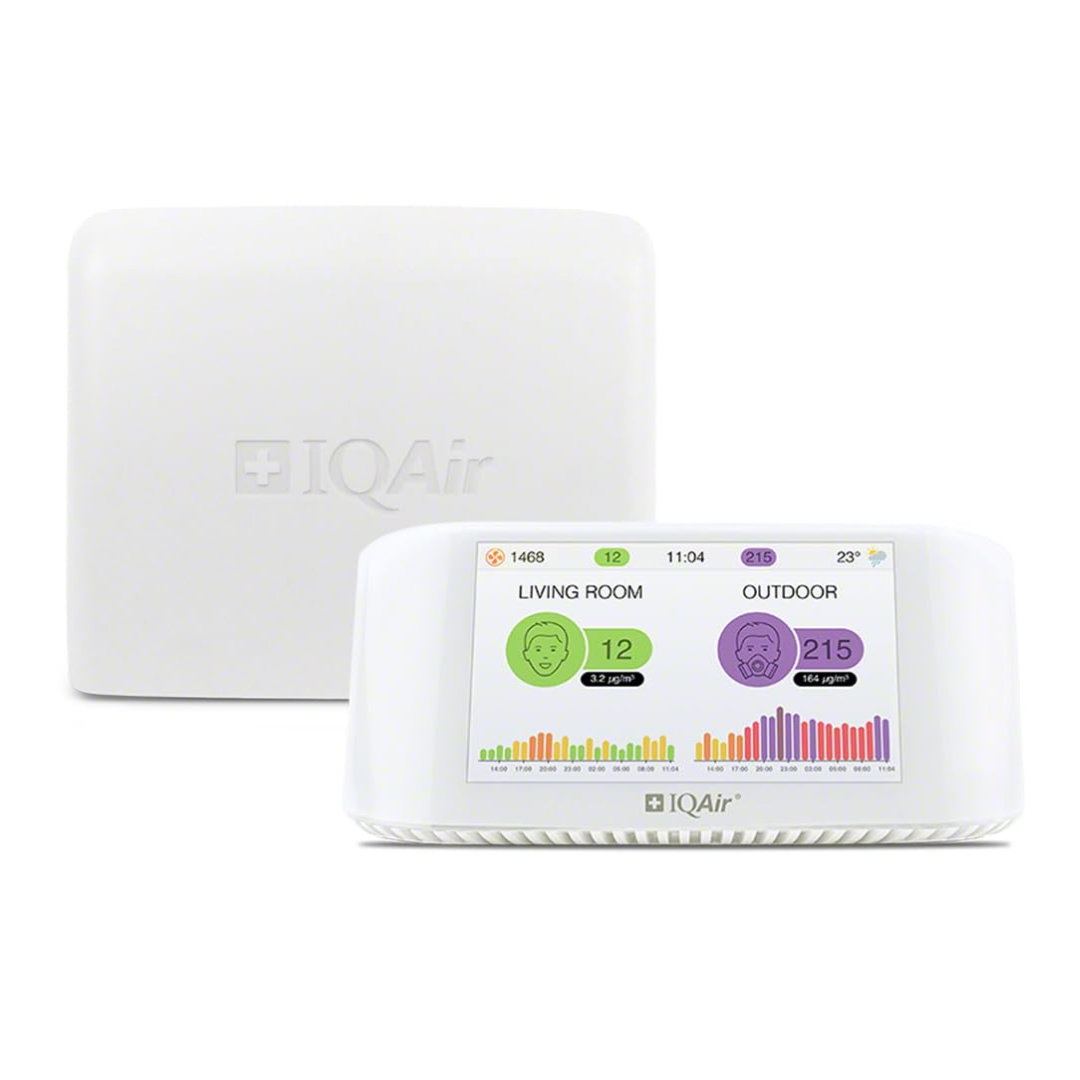
 | Close your windows to avoid dirty outdoor air GET A MONITOR |
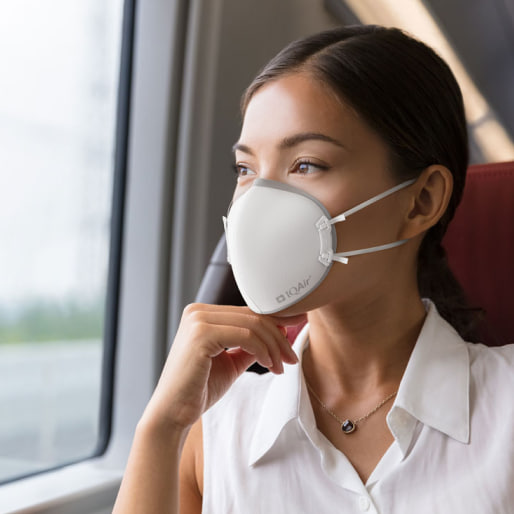
 | Sensitive groups should wear a mask outdoors GET A MASK |
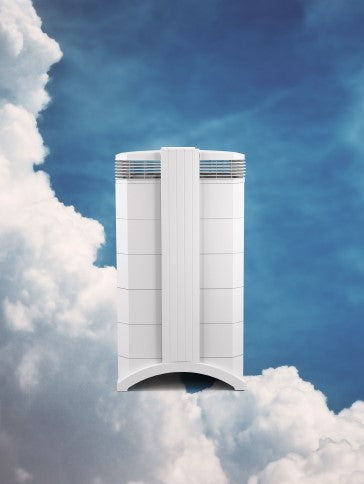
 | Run an air purifier GET AN AIR PURIFIER |
| Day | Pollution level | Weather | Temperature | Wind |
|---|---|---|---|---|
| Today | Unhealthy for sensitive groups 111 AQI US | 104° 84.2° | ||
| Sunday, May 12 | Unhealthy for sensitive groups 138 AQI US | 105.8° 86° | ||
| Monday, May 13 | Unhealthy for sensitive groups 103 AQI US | 109.4° 86° | ||
| Tuesday, May 14 | Unhealthy for sensitive groups 107 AQI US | 111.2° 84.2° | ||
| Wednesday, May 15 | Moderate 97 AQI US  | 111.2° 84.2° | ||
| Thursday, May 16 | Moderate 92 AQI US | 114.8° 86° | ||
| Friday, May 17 | Moderate 100 AQI US | 114.8° 91.4° |
Interested in hourly forecast? Get the app
News
The latest air quality news and resources.
Bhiwadi is a city in the Alwar district of Rajasthan state in India. It is well-known as an industrial hub. It is 70 kilometres away from New Delhi and 200 kms from Jaipur. In 2011 it was estimated to have a population of around 105,000 inhabitants, though that figure will no doubt have increased now.
The town itself is spread over 5,000 acres with about half of that devoted to housing. The remainder is used by industries of various sizes ranging from steel mills and furnaces to automobile and electronics manufacturing plants.
At the start of the second quarter in 2021, the quality of air in Bhiwadi as classed as “Hazardous” with a US AQI reading of 366. This is in accordance with recommendations by the World Health Organisation (WHO). The recorded concentrations of the pollutants were as follows: PM2.5 - 213.5 µg/m³, PM10 - 477.9 µg/m³, ozone (O3) - 5 µg/m³, nitrogen dioxide (NO2) - 49 µg/m³ and sulphur dioxide (SO2) - 93.1 µg/m³. It currently ranks as the second dirtiest city in India, trailing by 2 points behind Dharuhera, Haryana.
With conditions as hazardous as these, everybody is advised to wear a good quality mask when going outdoors. Avoid opening doors and windows to let in more polluted air. All outdoor exercise must be avoided until the air quality improves, and if you have the option, consider using an air purifying device in your main room at home.
Unfortunately, it is consistently “Unhealthy” for 11 months out of the 12 with readings between 55.5 and 150.4 µg/m³. Only during the month of October was it different and in that month the quality was even worse when it was “Very Unhealthy” with figures between 150.5 and 250.4 µg/m³.
Looking at the historic figures since 2018, the air quality seems inconsistent. In 2018 it was 125.4 µg/m³ followed by 83.4 µg/m³ in 2019 and 95.5 µg/m³ in 2020.
Towards the end of 2020 just after the Diwali festivals when pollution rises because of the fireworks used in their celebrations, data was released by the local monitoring system. Any figure between 301 and 400 means that staying out side when the figures are so high will lead to respiratory problems. Very often with immediate effect. The figure released for Bhiwadi was 447!
It was revealed that 47 per cent of the pollution in Bhiwadi is caused by dirt and dust. At the same time, 30 per cent is from industries. While 12 per cent of the pollution is due to vehicles. The remaining pollution is due to construction work and burning of garbage etc.
A large percentage of the polluted air in Bhiwadi is due to wildfires burning in neighbouring states. It is then dependant on the direction of the prevailing winds as to whether or not the polluted air travels towards Bhiwadi.
To prevent pollution by dust rising off the unpaved roads, the local authority gave instructions for the streets to be sprayed with water to prevent the dust rising. Under such extreme circumstances when air pollution levels almost go off the scale, many other measures are taken in order to reduce to harmful effects.
Factories that use coal or wood as a fuel source are told to cease operations until further notice. Stone crushers and hot mixing plants also fall into that category and are closed until further notice.
Particulate Matter, of both PM2.5 and PM10 is often used as an indicator for the general levels of air pollution. It is known to affect more people than any other pollutant. The main components of PM are nitrates, sulphates, ammonia, black carbon, sodium chloride, mineral dust and water. They often attract fine metallic particles too which attach themselves to the carrier.
It consists of a complex mixture of both solid and liquid particles of organic and inorganic substances that become suspended in the air.
Because of its microscopic size, PM2.5 is particularly dangerous as it can easily bypass the body’s natural defence system and penetrate deeply into the lungs. From here, they can easily get into the blood.
Particulate matter (PM) is one of the biggest health hazards to air pollution and according to studies, it is responsible for the deaths of millions of people every year. This means that high blood pressure, smoking, diabetes and obesity along with poor air quality and particulate matter are among the five most dangerous factors for health. What makes Particulate Matter pollution so dangerous it is not yet properly known, but research is constantly being done in order to find out why.
Sometimes it can be very difficult to control air pollution, especially when it is blown in by the wind from neighbouring areas. Air quality conditions have deteriorated throughout North India. In spite of many efforts and court orders, burning of straw in Haryana-Punjab is gaining momentum. Government efforts for stubble management appear to be having little effect.
According to the US space agency NASA and the System of Air Quality and Weather Forecasting and Research (SAFAR) in India, the incidents of stubble burning in Punjab and Haryana are increasing day by day. Due to this, local pollution is increasing not only in Delhi but also in the surrounding areas.
Another method would be to control the emissions from industry by installing filtration systems on the chimneys, but this can be expensive and therefore unpopular.
Vehicle emissions contribute considerably to the air pollution because many of the vehicles on the roads are old and not built to the latest standards. Replacing them, though is not an option for many users.
Dried animal dung is still used as a fuel source for both cooking and heating the homes in cooler weather. This produces a lot of toxic fumes which are often released into unventilated rooms where children often accompany their mothers. Changing this traditional way of using dung as fuel will be very difficult. Many households cannot afford to buy new equipment needed to use gas or electric stoves.
No locations are available.