Get a monitor and contributor to air quality data in your city.

29.1K people follow this city


AIR QUALITY DATA CONTRIBUTORS
Central Pollution Control Board
See all

| Weather | Rain |
| Temperature | 82.4°F |
| Humidity | 84% |
| Wind | 11.5 mp/h |
| Pressure | 29.8 Hg |
| # | city | US AQI |
|---|---|---|
| 1 |  Delhi, Delhi Delhi, Delhi | 173 |
| 2 | New Delhi, Delhi | 163 |
| 3 | Jabalpur, Madhya Pradesh | 130 |
| 4 | Jaipur, Rajasthan | 94 |
| 5 | Hubli, Karnataka | 88 |
| 6 | Vijayawada, Andhra Pradesh | 87 |
| 7 | Indore, Madhya Pradesh | 84 |
| 8 | Bengaluru, Karnataka | 82 |
| 9 | Gharghoda, Chhattisgarh | 81 |
| 10 | Cuddalore, Tamil Nadu | 79 |
(local time)
SEE WORLD AQI RANKING
| # | station | US AQI |
|---|---|---|
| 1 | Lingraj Mandir, Bhubaneswar - OSPCB | 155 |
(local time)
SEE WORLD AQI RANKING
US AQI
155
live AQI index
Unhealthy

| Air pollution level | Air quality index | Main pollutant |
|---|---|---|
| Unhealthy | 155 US AQI | PM2.5 |
| Pollutants | Concentration | |
|---|---|---|
| PM2.5 | 61.5µg/m³ | |
| PM10 | 116.5µg/m³ | |
| O3 | 76.6µg/m³ | |
| NO2 | 5.1µg/m³ | |
| SO2 | 3.5µg/m³ | |
| CO | 440µg/m³ | |
PM2.5
x12.3
PM2.5 concentration in Bhubaneshwar is currently 12.3 times the WHO annual air quality guideline value
 | Avoid outdoor exercise |
 | Close your windows to avoid dirty outdoor air GET A MONITOR |
 | Wear a mask outdoors GET A MASK |
 | Run an air purifier GET AN AIR PURIFIER |
| Day | Pollution level | Weather | Temperature | Wind |
|---|---|---|---|---|
| Thursday, May 9 | Moderate 66 AQI US  | 96.8° 78.8° | ||
| Friday, May 10 | Moderate 60 AQI US | 95° 78.8° | ||
| Saturday, May 11 | Moderate 72 AQI US | 98.6° 80.6° | ||
| Today | Unhealthy 155 AQI US | 98.6° 80.6° | ||
| Monday, May 13 | Moderate 67 AQI US | 96.8° 82.4° | ||
| Tuesday, May 14 | Moderate 68 AQI US | 100.4° 80.6° | ||
| Wednesday, May 15 | Moderate 72 AQI US | 98.6° 82.4° | ||
| Thursday, May 16 | Moderate 75 AQI US | 98.6° 80.6° | ||
| Friday, May 17 | Moderate 76 AQI US | 98.6° 80.6° | ||
| Saturday, May 18 | Moderate 78 AQI US | 104° 82.4° | ||
| Sunday, May 19 | Moderate 83 AQI US | 109.4° 82.4° |
Interested in hourly forecast? Get the app
News
The latest air quality news and resources.
Bhubaneswar is the capital and largest city of the Indian state of Odisha. It is in the Khordha district of Odisha on the eastern coastal plains, along the axis of the Eastern Ghats Mountains. The city has an average altitude of 45 metres above sea level. The last census to record the population was back in 2011 when the figure was 1.3 million. This figure will be considerably larger now.
At the beginning of 2021, Bhubaneswar was experiencing some very “Unhealthy “air with a US AQI figure of 184. This level is based on recommendations from the World Health Organisation (WHO). The concentration level of PM2.5 was recorded as 120.3 µg/m³.
With relatively high levels of pollution, the advice is to close windows and doors to prevent the ingress of pouted air from outside. All forms of outdoor exercise should be postponed until the quality improves. Those of a sensitive disposition are advised to wear a good quality face mask if venturing outside is unavoidable.
Bhubaneswar is one of the top two cities in India where air pollution has reached alarming levels. According to the Air Quality Life Index (AQLI) compiled by the Energy Policy Institute of the University of Chicago, the World Health Organisation's regulations could not be followed.
Throughout 2019, the quality of air was generally “Unhealthy for sensitive groups” with recorded figures between 35.5 and 55.4 µg/m³. However, during the month of February in both Belpahar and Talcher, the WHO target figure of less than 10 µg/m³ was attained. Unfortunately, this was certainly not the case for the rest of the year when levels reached very “Unhealthy” with figures between 55.5 and 150.4 µg/m³. Talcher is showing signs of improvement, in comparison to 2018 when the average figure was 58 µg/m³. It had dropped 20 points to the 2019 mean figure of 38.4 µg/m³.
With an ever-increasing population, construction activity and transportation, the pollution control board in Orissa has reported that levels of suspended particulate matter PM2.5 and PM10 are well above the acceptable levels even in the summer months. As there is no proper system to manage waste in landfills as yet in the city, pollution from burning waste is another source that needs to be addressed very soon.
It has been put forward that the main contributor to the polluted air is not from vehicle emissions but from the dust pushed up into the air through their movement or passing. The main culprit is thought to be construction materials at the side of the roads and the transportation of such materials in open trucks.
The level of PM10 averaged between 120 and 213 µg/m³; the acceptable level is just 100 µg/m³.
The reduction in the number of vehicles on the city streets would be the obvious way to reduce air pollution. Drivers need to be encouraged to use public transport or to cycle instead. The more people who are aware of the situation, the bigger and stronger their voice when it comes to tackling the problem from a governmental aspect.
The banning of straw burning after the harvest would save a huge amount of air pollution but it is low cost and easy. The alternatives are not as convenient nor are they as cheap.
The use of electric vehicles will undoubtedly lead to less pollution in and around the city centre and it was also suggested to adopt zig-zag technology in brick kilns in various states to reduce pollution. It was also mentioned that people’s participation is a must to clean the air and the use of public transport must be promoted.
In January 2019, it was launched the NCAP to tackle the air pollution with a target to achieve 20 to 30 per cent reduction in PM10 and PM2.5 levels by 2024.
There are a number of local trees which are able to capture air pollution. It has been decided that this species needs to be planted throughout the city in an attempt to curb the pollution.
According to the Air Quality Life Index (AQLI), the average life expectancy of residents in Bhubaneswar could have been increased by two years and seven months if air pollution had been prevented.
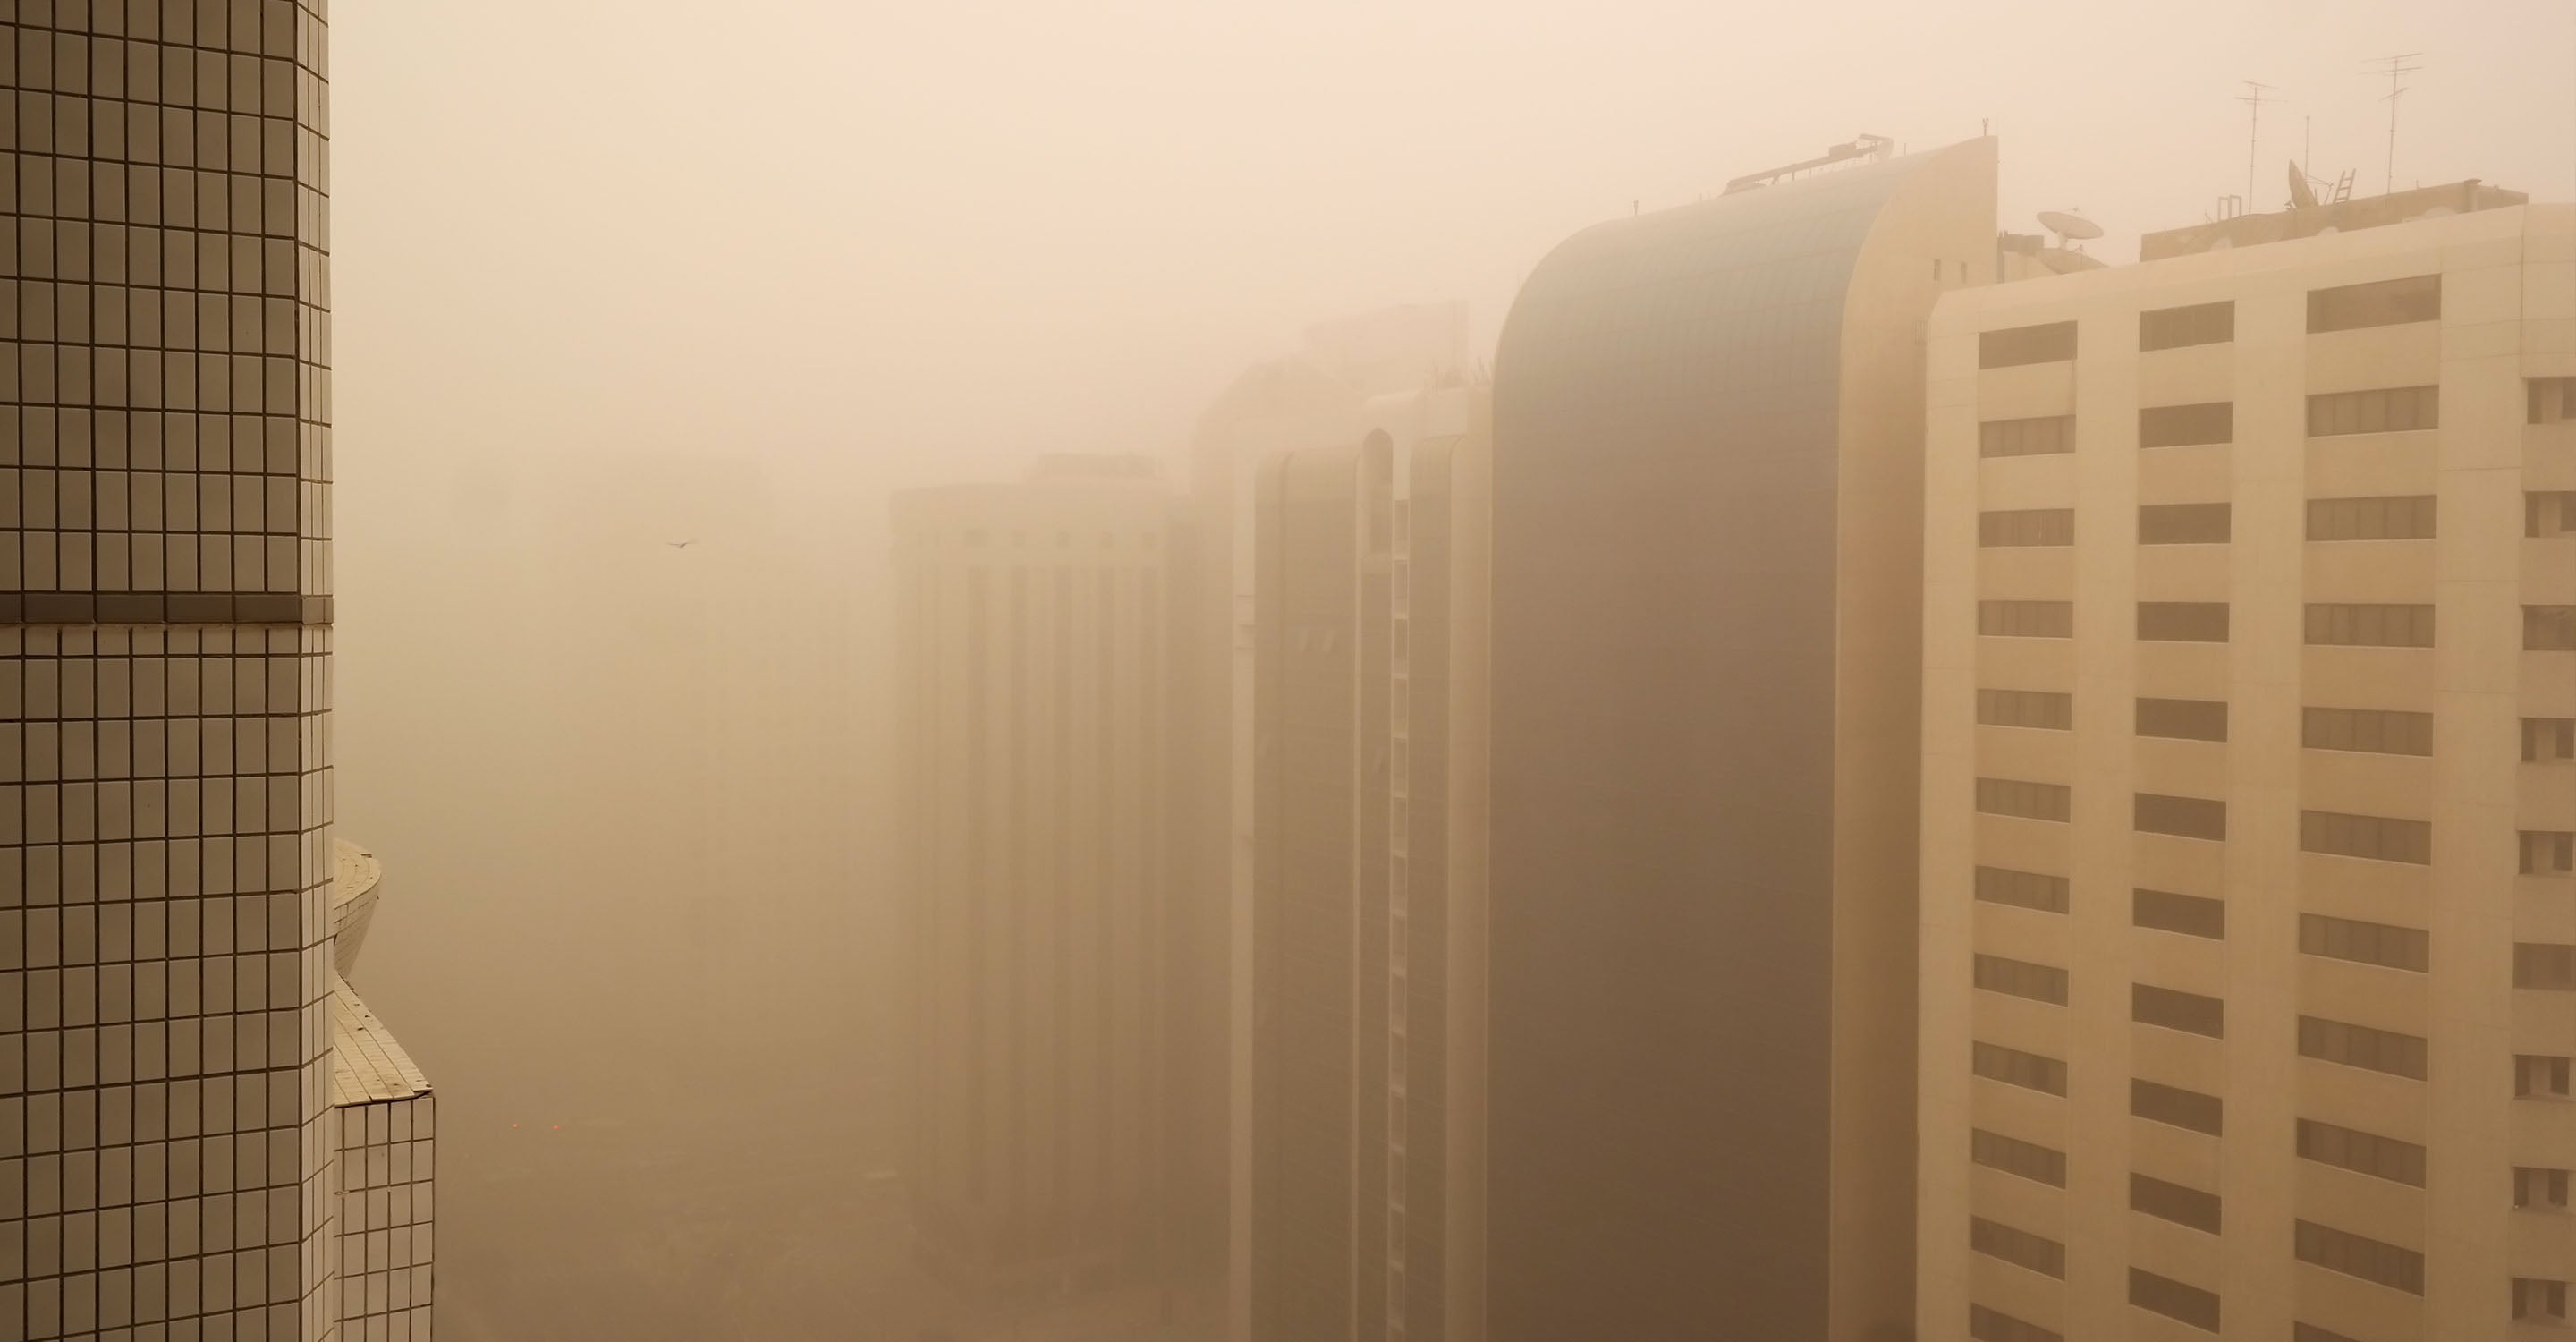
Bhubaneswar had the worst foggy sky in its history this winter. Bhubaneswar recorded an alarming level of particulate matter (PM2.5 and PM10) in the air. It leads to a serious aggravation of heart and lung diseases and increases the risk of premature death. It could also lead to cardio-respiratory diseases.
Carbon monoxide mainly comes from fossil fuels that are not completely burned. Most of the carbon monoxide in the air in Bhubaneshwar comes from the exhaust from vehicles. It reduces the oxygen-carrying capacity of red blood cells, and its impact on health depends on the length of time the body is exposed to it and the concentration of carbon monoxide inhaled. The average person feels headache, dizziness and fatigue when inhaling low levels of carbon monoxide. High concentrations of carbon monoxide can cause blurred vision, loss of coordination, and even death.
Ground-level ozone is formed by photochemical reactions of nitrogen oxides and volatile organic compounds mainly emitted from vehicles and factories. As it needs sunlight to complete the reaction, the levels of ozone usually increase as the day passes.
Suspended particles PM2.5 and PM10 come from many sources and can be produced by human activities and also naturally. The burning of fossil fuels such as the exhaust from vehicles and power stations and the burning of living organisms such as wildfires or stubble burning are the main sources. Generally speaking, suspended particles are a complex mixture of solid and liquid organic and inorganic substances which are suspended in the air.
Suspended particles can be defined according to their diameter, such as PM10 (particles with diameter less than 10 µm) or PM2.5 (less than 2.5 µm). The latter are more dangerous because when inhaled, they can penetrate deeper into the lungs. According to many studies, there is an important relationship between the number of people admitted to hospital and premature deaths due to respiratory and cardiovascular diseases and the concentration of suspended particles. Patients with cardiovascular diseases and chronic respiratory diseases are more susceptible. Suspended particles have been designated by the International Agency for Research on Cancer as human carcinogens.
1Contributor
Government Contributor
1 station
1 Data source