Be the first to measure and contribute air quality data to your community

5.3K people follow this city


AIR QUALITY DATA SOURCE

| Index | None | ||
| Tree pollen | None | ||
| Grass pollen | None | ||
| Weed pollen | None |

| Weather | Scattered clouds |
| Temperature | 55.4°F |
| Humidity | 78% |
| Wind | 5.7 mp/h |
| Pressure | 30.3 Hg |
| # | city | US AQI |
|---|---|---|
| 1 |  Armidale, New South Wales Armidale, New South Wales | 64 |
| 2 | Spencer Gulf, South Australia | 60 |
| 3 | Wagga Wagga, New South Wales | 55 |
| 4 | Bathurst, New South Wales | 47 |
| 5 | Singleton, New South Wales | 39 |
| 6 | Melbourne, Victoria | 36 |
| 7 | Adelaide, South Australia | 34 |
| 8 | Geelong, Victoria | 34 |
| 9 | Newcastle, New South Wales | 34 |
| 10 | Orange, New South Wales | 33 |
(local time)
SEE WORLD AQI RANKING

US AQI
65*
live AQI index
Moderate

| Air pollution level | Air quality index | Main pollutant |
|---|---|---|
| Moderate | 65* US AQI | PM2.5 |
| Pollutants | Concentration | |
|---|---|---|
| PM2.5 | 16.6*µg/m³ | |
PM2.5
x3.3
PM2.5 concentration in East Lindfield is currently 3.3 times the WHO annual air quality guideline value
 | Sensitive groups should reduce outdoor exercise |
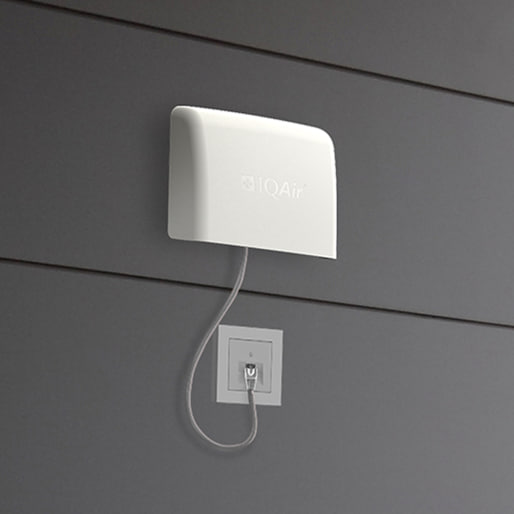
 | Close your windows to avoid dirty outdoor air GET A MONITOR |
 | Sensitive groups should wear a mask outdoors GET A MASK |
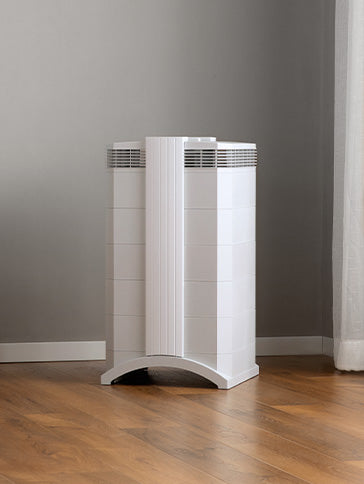
 | Sensitive groups should run an air purifier GET AN AIR PURIFIER |
| Day | Pollution level | Weather | Temperature | Wind |
|---|---|---|---|---|
| Today | Moderate 65 AQI US | 64.4° 48.2° | ||
| Friday, May 24 | Moderate 57 AQI US | 62.6° 50° | ||
| Saturday, May 25 | Moderate 56 AQI US | 62.6° 55.4° | ||
| Sunday, May 26 | Moderate 60 AQI US | 66.2° 50° | ||
| Monday, May 27 | Moderate 72 AQI US | 64.4° 50° | ||
| Tuesday, May 28 | Moderate 71 AQI US | 66.2° 50° | ||
| Wednesday, May 29 | Moderate 76 AQI US | 69.8° 51.8° |
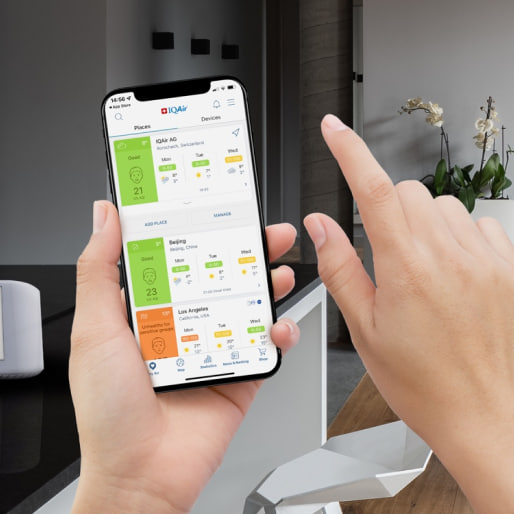
Interested in hourly forecast? Get the app
News
The latest air quality news and resources.
No locations are available.