Be the first to measure and contribute air quality data to your community

22 people follow this city


AIR QUALITY DATA SOURCE

| Index | Very high | ||
| Tree pollen | Very high | ||
| Grass pollen | Very high | ||
| Weed pollen | None |

| Weather | Scattered clouds |
| Temperature | 68°F |
| Humidity | 46% |
| Wind | 6.9 mp/h |
| Pressure | 29.9 Hg |
| # | city | US AQI |
|---|---|---|
| 1 |  La Habra, California La Habra, California | 89 |
| 2 | Claremont, California | 87 |
| 3 | San Bernardino, California | 87 |
| 4 | Downey, California | 85 |
| 5 | Fontana, California | 84 |
| 6 | Maricopa, Arizona | 84 |
| 7 | Pomona, California | 83 |
| 8 | Compton, California | 79 |
| 9 | Riverside, California | 79 |
| 10 | San Gabriel, California | 78 |
(local time)
SEE WORLD AQI RANKING

US AQI
55*
live AQI index
Moderate

| Air pollution level | Air quality index | Main pollutant |
|---|---|---|
| Moderate | 55* US AQI | PM2.5 |
| Pollutants | Concentration | |
|---|---|---|
| PM2.5 | 11.5*µg/m³ | |
PM2.5
x2.3
PM2.5 concentration in Randleman is currently 2.3 times the WHO annual air quality guideline value
 | Sensitive groups should reduce outdoor exercise |
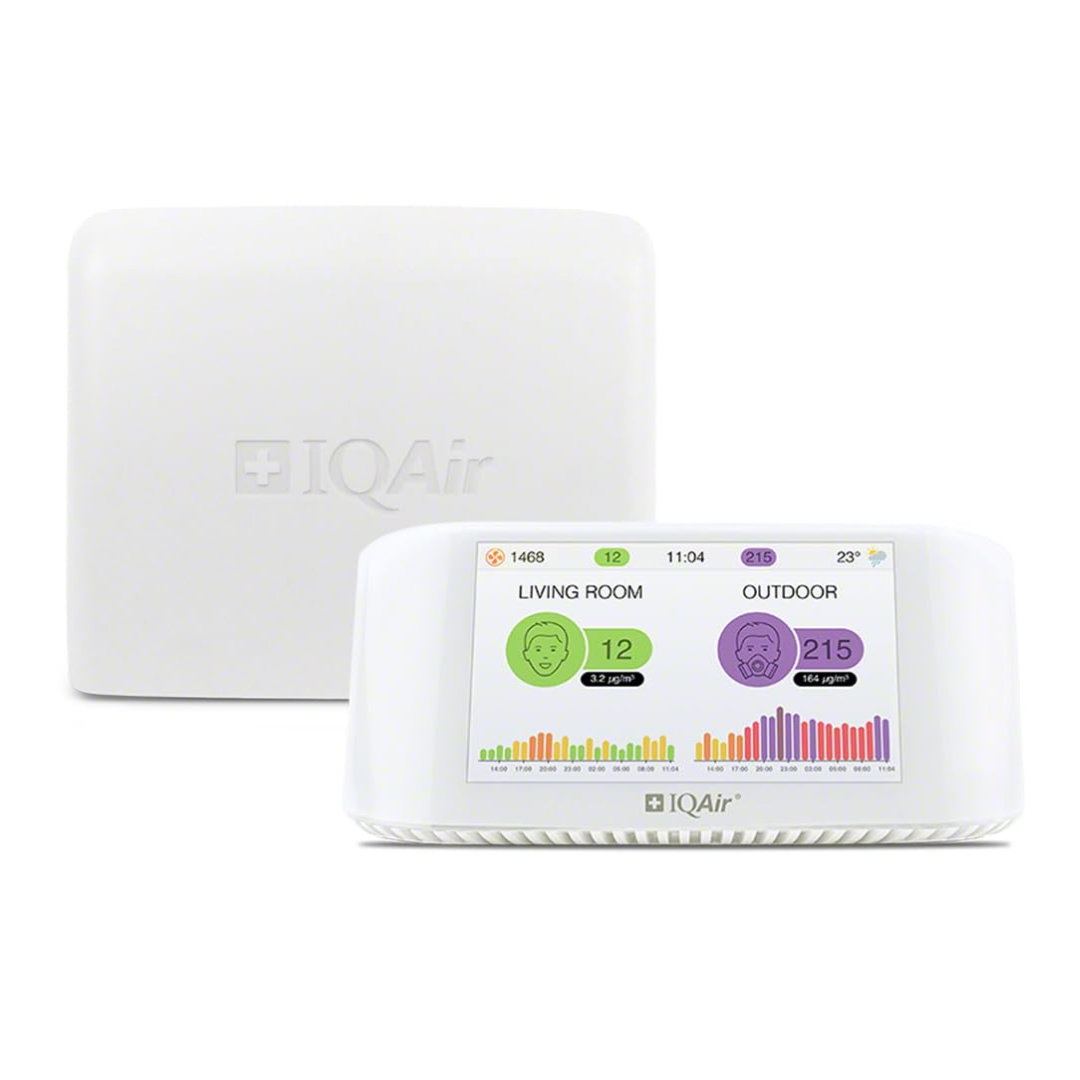
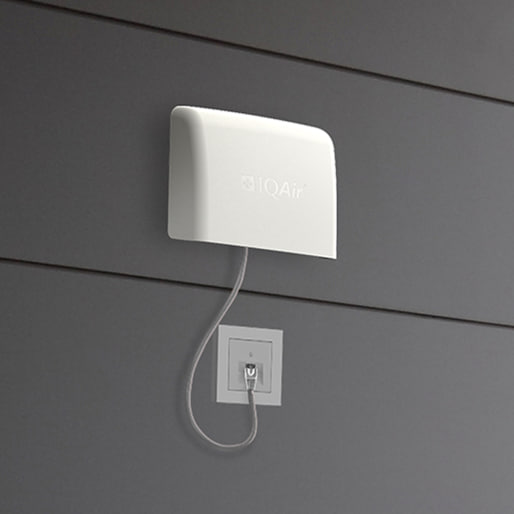
 | Close your windows to avoid dirty outdoor air GET A MONITOR |
 | Sensitive groups should wear a mask outdoors GET A MASK |
 | Sensitive groups should run an air purifier GET AN AIR PURIFIER |
| Day | Pollution level | Weather | Temperature | Wind |
|---|---|---|---|---|
| Today | Moderate 55 AQI US | 69.8° 46.4° | ||
| Sunday, May 12 | Good 43 AQI US  | 71.6° 50° | ||
| Monday, May 13 | Good 47 AQI US | 73.4° 50° | ||
| Tuesday, May 14 | Moderate 57 AQI US | 64.4° 57.2° | ||
| Wednesday, May 15 | Good 40 AQI US | 68° 60.8° | ||
| Thursday, May 16 | Moderate 65 AQI US | 77° 55.4° | ||
| Friday, May 17 | Moderate 76 AQI US | 68° 59° |
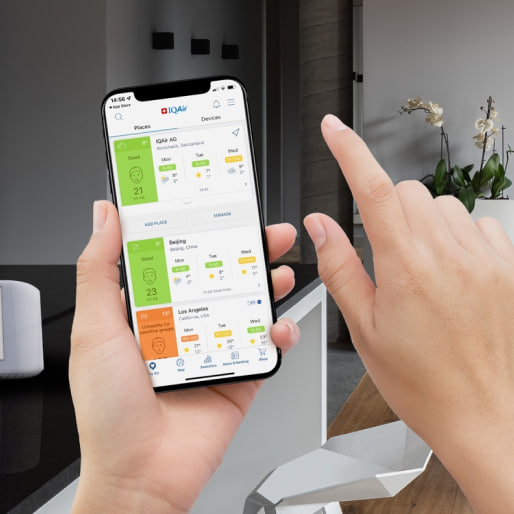
Interested in hourly forecast? Get the app
News
The latest air quality news and resources.
No locations are available.