Get a monitor and contributor to air quality data in your city.

4.1K people follow this city


AIR QUALITY DATA CONTRIBUTORS
6 Contributors


See all

| Weather | Few clouds |
| Temperature | 78.8°F |
| Humidity | 93% |
| Wind | 2.3 mp/h |
| Pressure | 29.8 Hg |
| # | city | US AQI |
|---|---|---|
| 1 | Chiang Rai, Chiang Rai | 141 |
| 2 | Bang Phli, Samut Prakan | 127 |
| 3 | Bang Na, Bangkok | 120 |
| 4 | Samut Prakan, Samut Prakan | 114 |
| 5 | Doi Saket, Chiang Mai | 108 |
| 6 | Phetchabun, Phetchabun | 107 |
| 7 | San Sai, Chiang Mai | 98 |
| 8 | Chom Thong, Bangkok | 97 |
| 9 | Mueang, Phayao | 97 |
| 10 | Bang Sao Thong, Samut Prakan | 96 |
(local time)
SEE WORLD AQI RANKING
| # | station | US AQI |
|---|---|---|
| 1 | Chollada Suvarnabhumi | 156 |
| 2 | RIO | 124 |
| 3 | Assumption University Suvarnabhumi Campus | 98 |
| 4 | Bang Na - Trat KM 21 | 82 |
| 5 | Chakri Naruebodindra Medical Institute | 73 |
| 6 | National Housing Authority Bangplee | 65 |
(local time)
SEE WORLD AQI RANKING
US AQI
90
live AQI index
Moderate

| Air pollution level | Air quality index | Main pollutant |
|---|---|---|
| Moderate | 90 US AQI | PM2.5 |
| Pollutants | Concentration | |
|---|---|---|
| PM2.5 | 30.1µg/m³ | |
PM2.5
x6
PM2.5 concentration in Bang Sao Thong is currently 6 times the WHO annual air quality guideline value
 | Sensitive groups should reduce outdoor exercise |
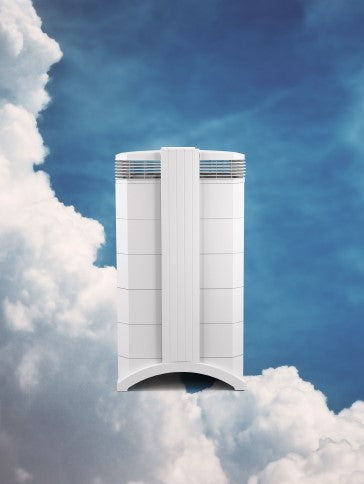
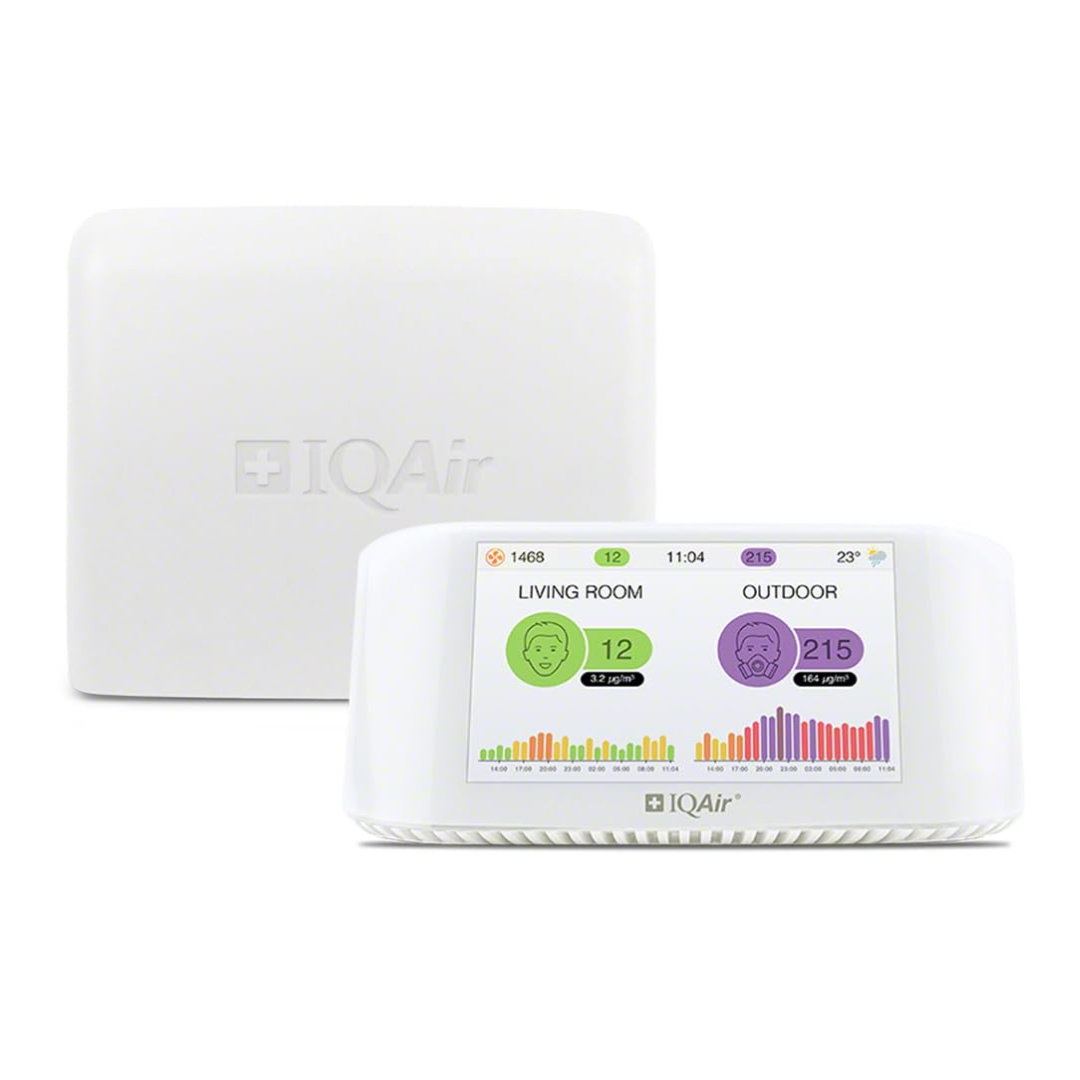
 | Close your windows to avoid dirty outdoor air GET A MONITOR |
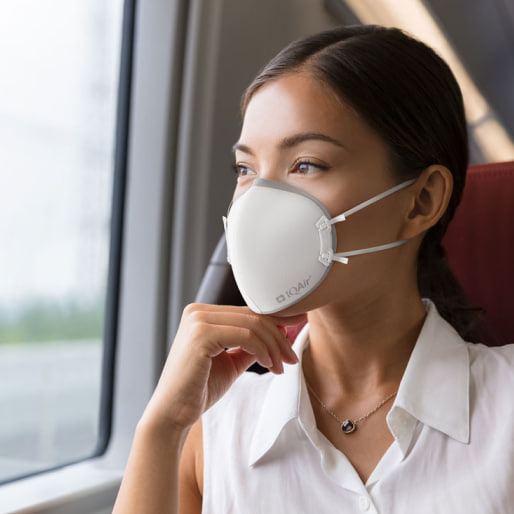
 | Sensitive groups should wear a mask outdoors GET A MASK |
 | Sensitive groups should run an air purifier GET AN AIR PURIFIER |
| Day | Pollution level | Weather | Temperature | Wind |
|---|---|---|---|---|
| Sunday, May 5 | Unhealthy for sensitive groups 110 AQI US  | 95° 86° | ||
| Monday, May 6 | Moderate 87 AQI US | 96.8° 86° | ||
| Tuesday, May 7 | Moderate 64 AQI US | 87.8° 80.6° | ||
| Today | Moderate 90 AQI US | 87.8° 80.6° | ||
| Thursday, May 9 | Moderate 69 AQI US | 95° 78.8° | ||
| Friday, May 10 | Moderate 78 AQI US | 95° 84.2° | ||
| Saturday, May 11 | Moderate 75 AQI US | 87.8° 78.8° | ||
| Sunday, May 12 | Moderate 69 AQI US | 93.2° 82.4° | ||
| Monday, May 13 | Moderate 66 AQI US | 93.2° 84.2° | ||
| Tuesday, May 14 | Moderate 63 AQI US | 93.2° 84.2° | ||
| Wednesday, May 15 | Moderate 63 AQI US | 87.8° 77° |
Interested in hourly forecast? Get the app
News
The latest air quality news and resources.
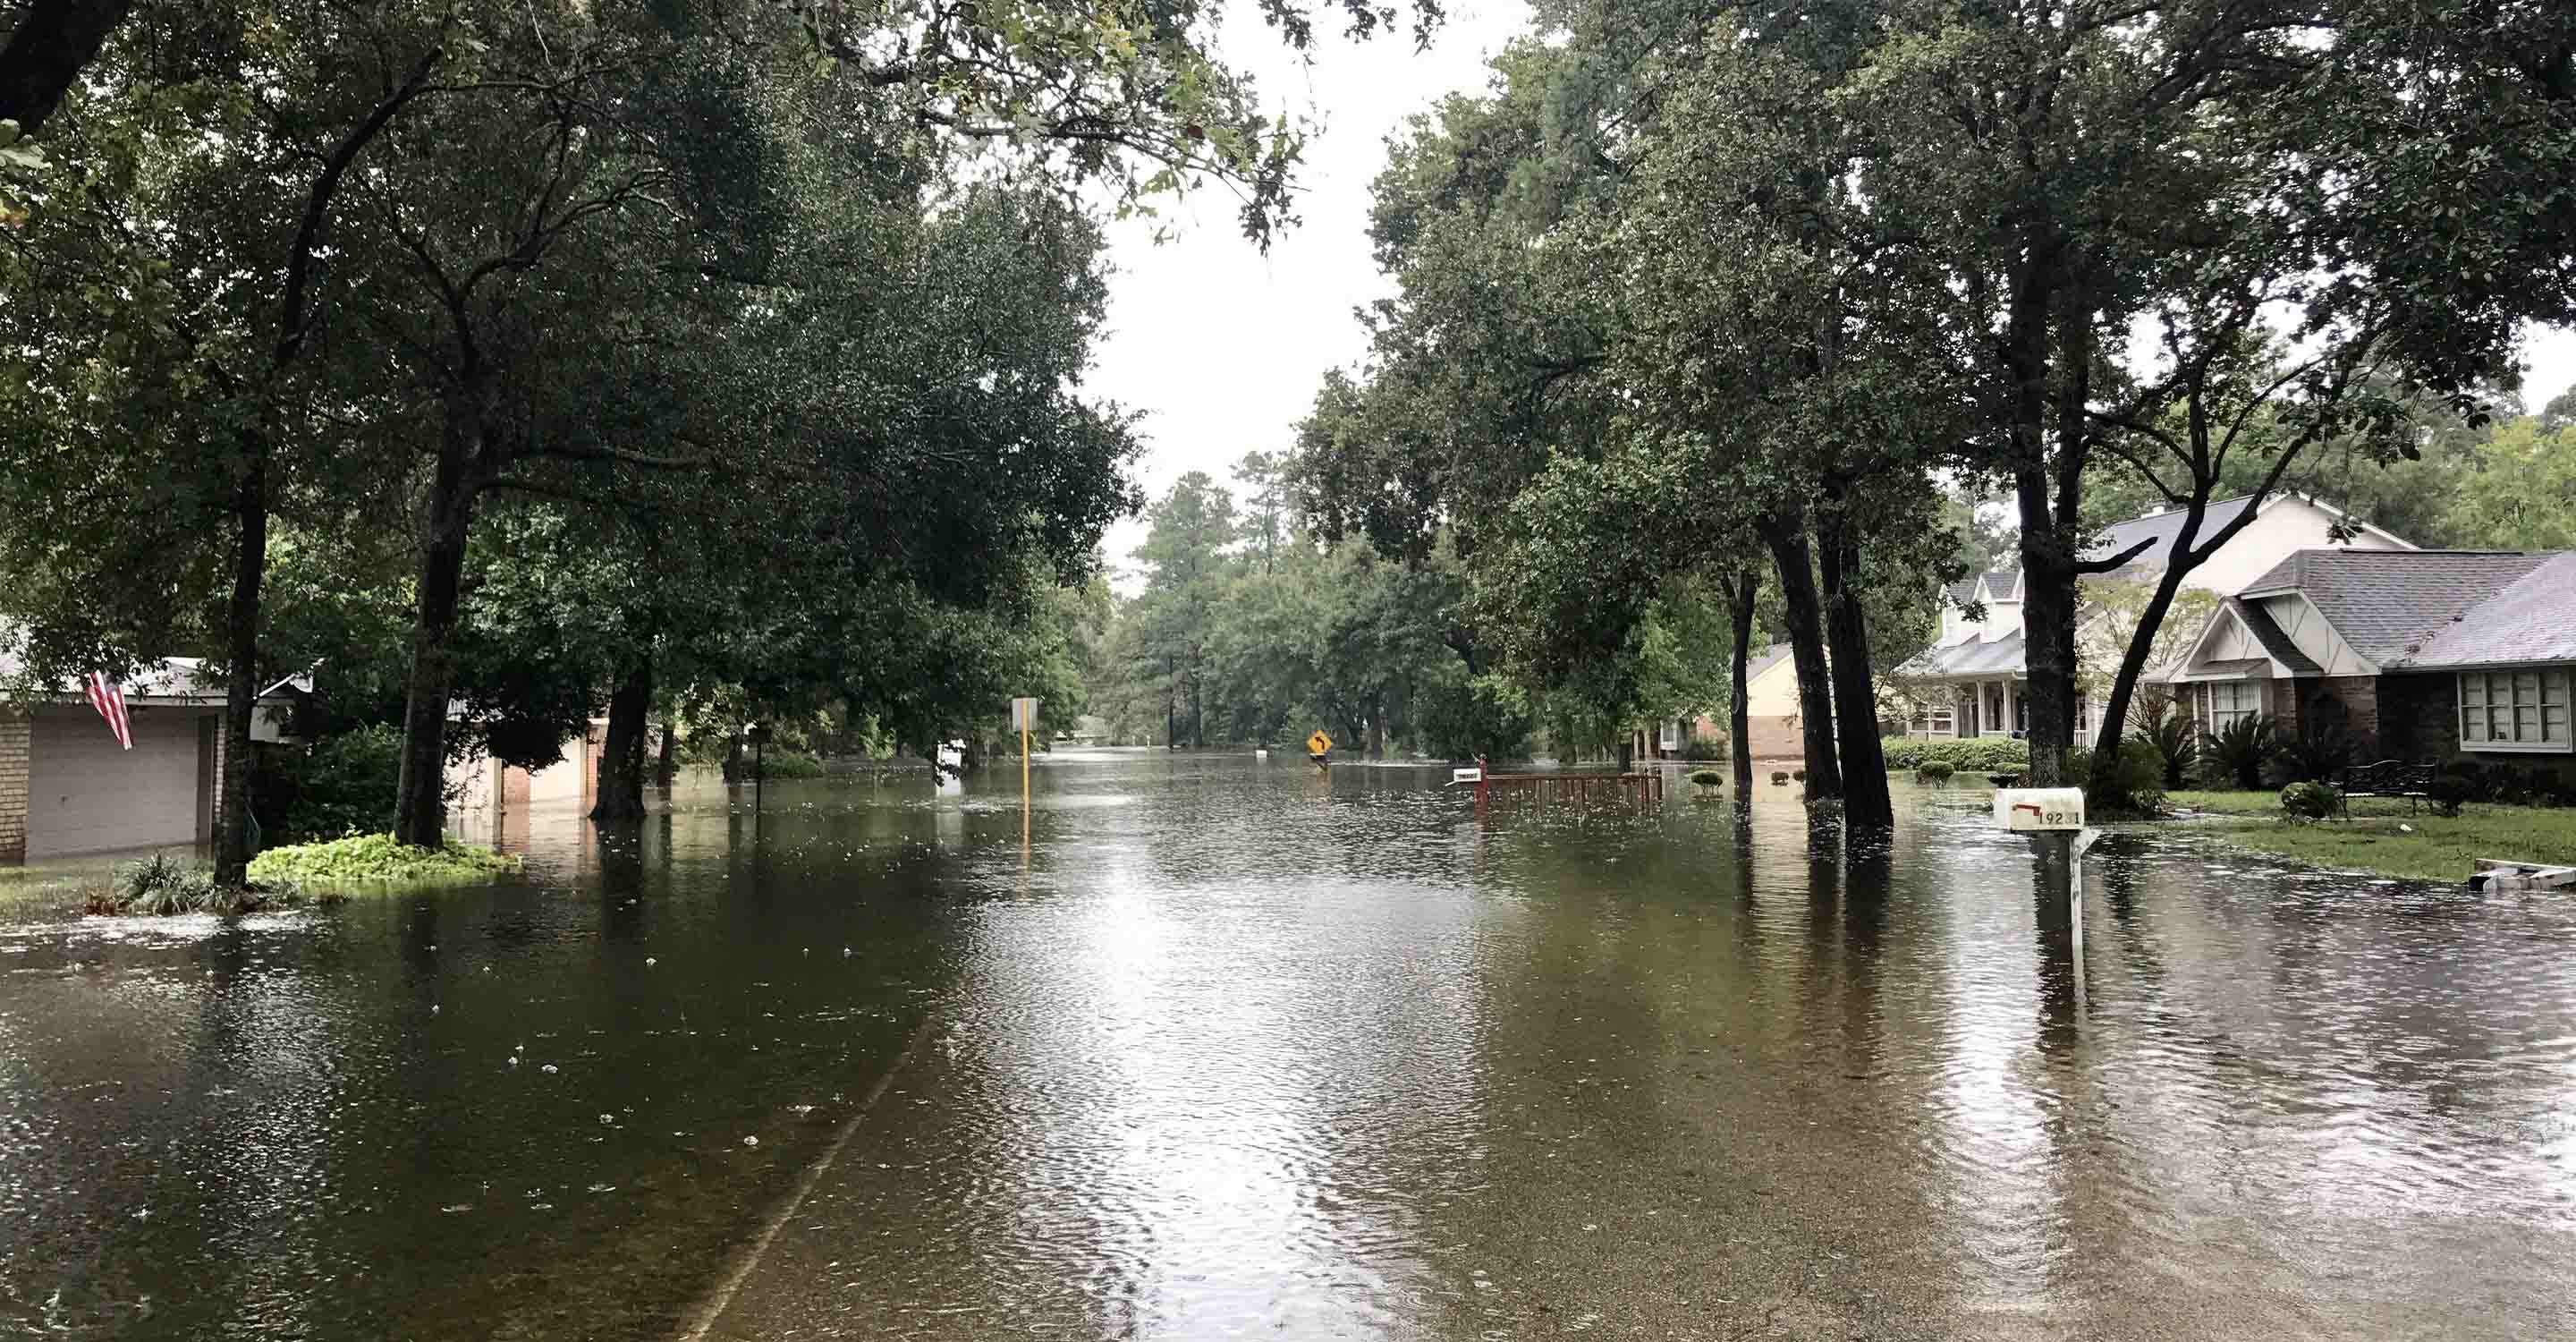
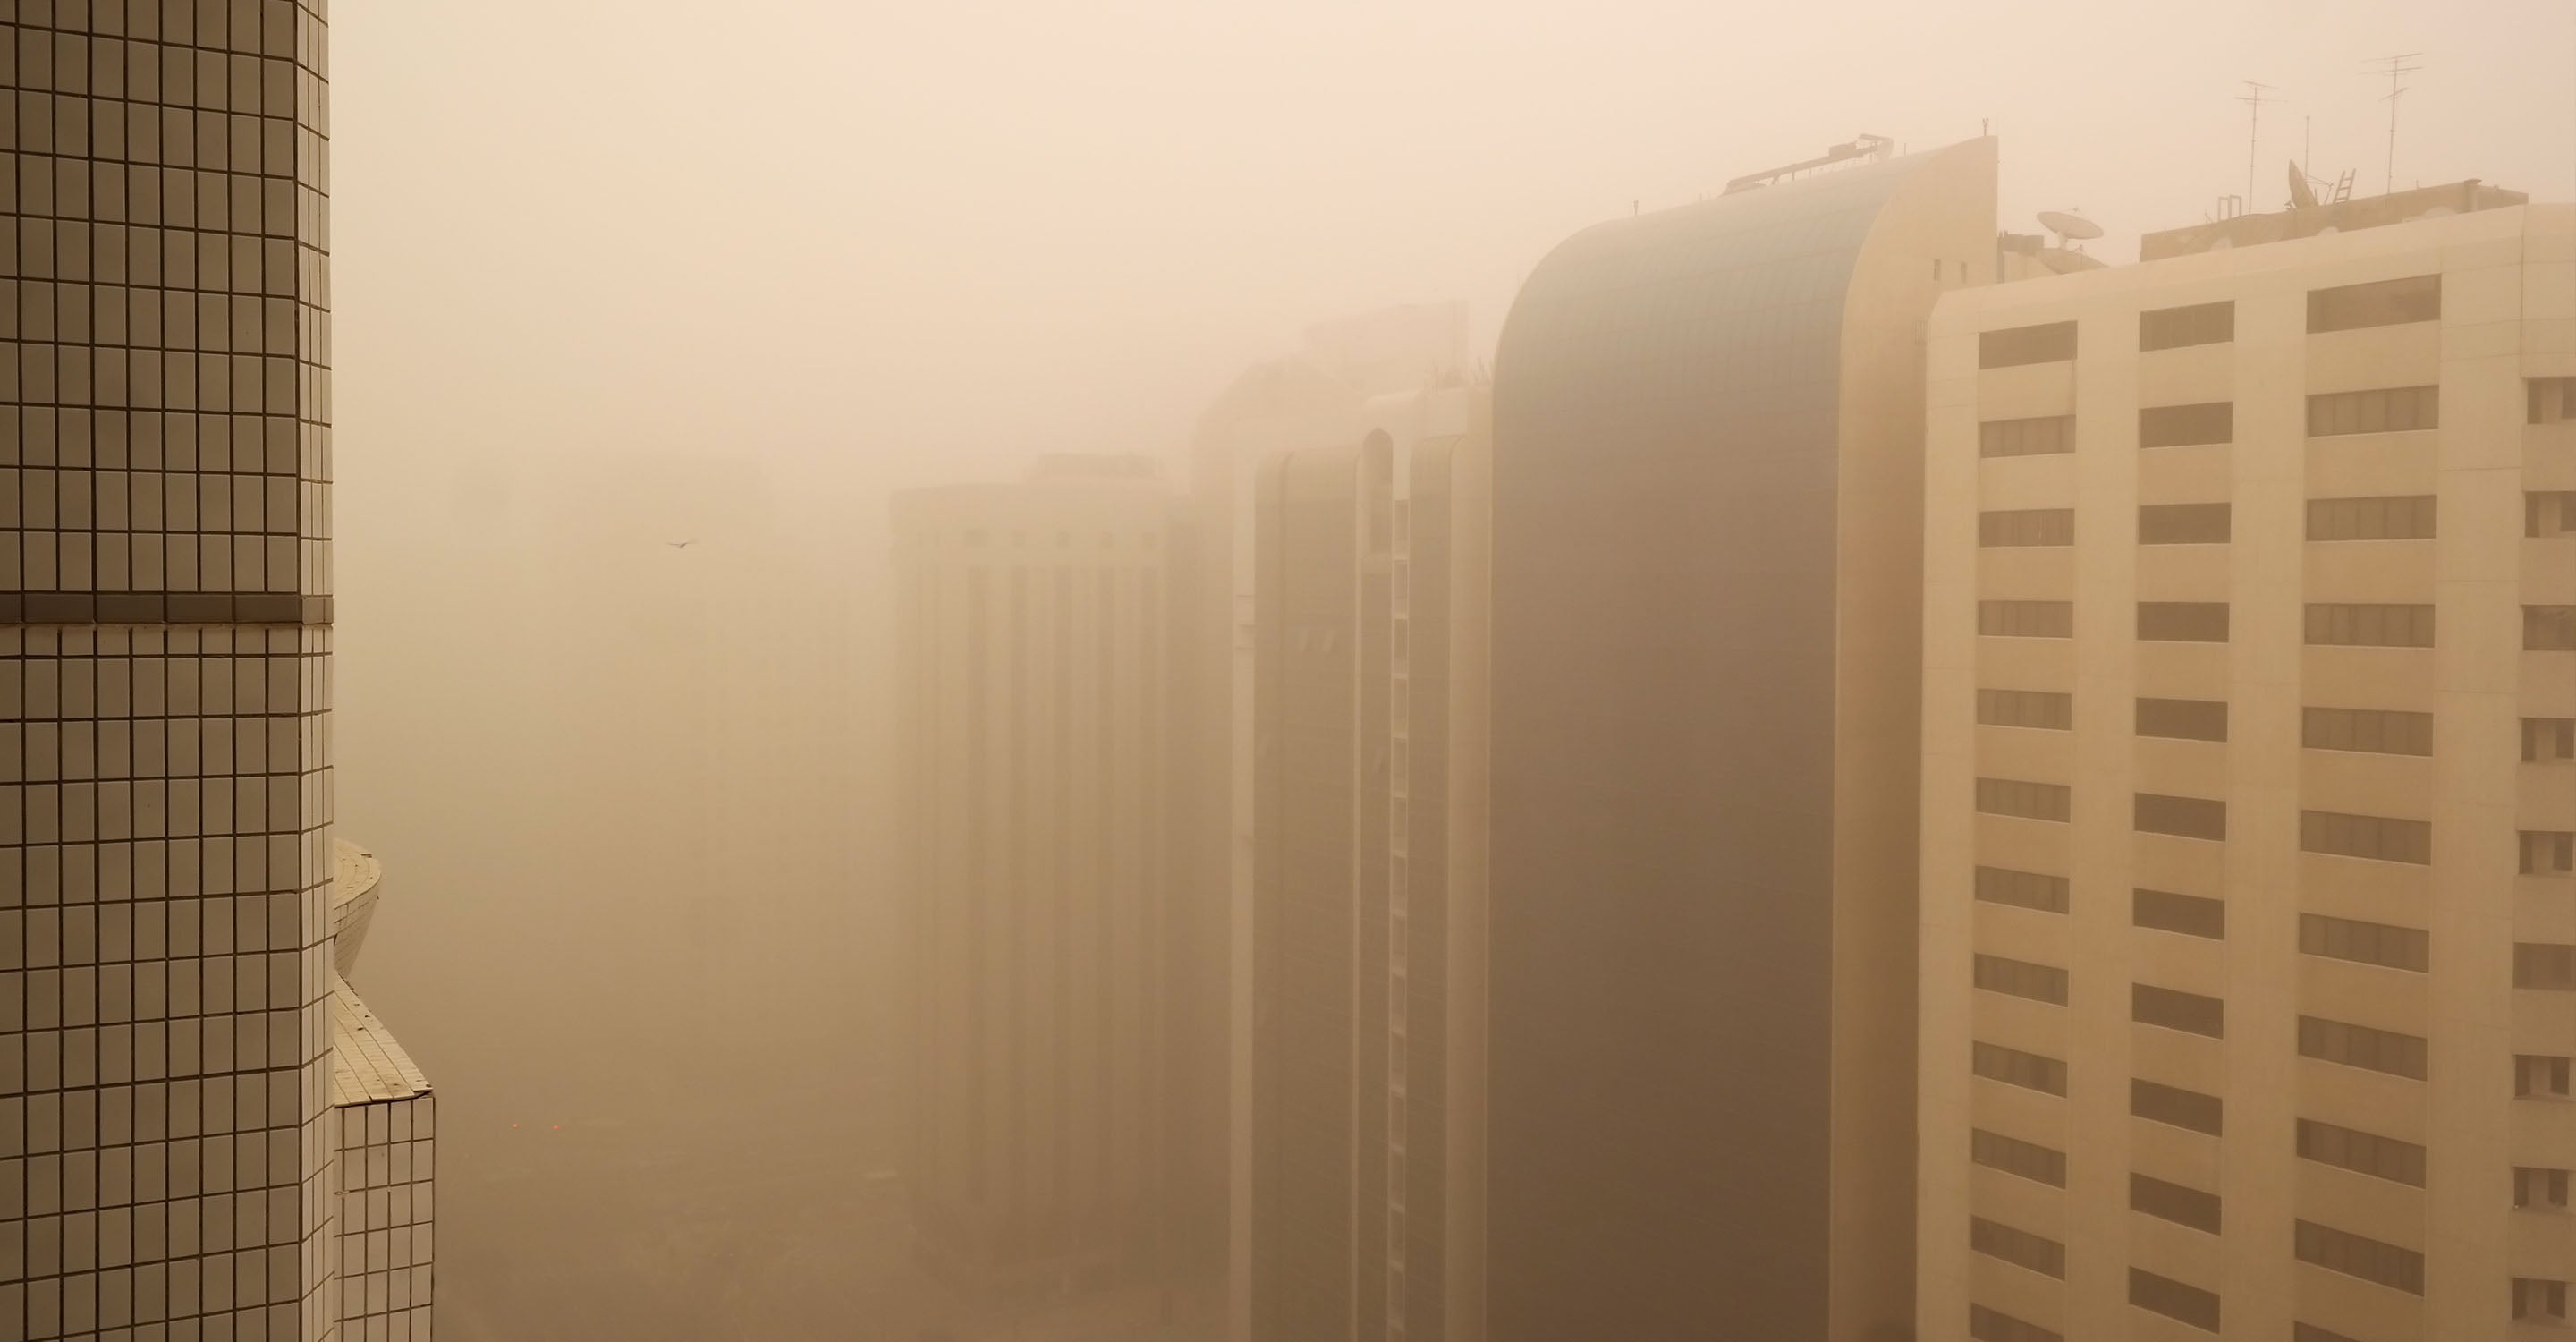
Air pollution is an issue that affects many regions, provinces and cities throughout Thailand, and Bang Sao Thong has no exception to this, with many months of the year coming in with elevated readings of air pollution, containing all manner of contaminating elements such as chemical compounds as well as fine particle pollution. Looking at the air quality levels taken in late September of 2021, using the US AQI measure as an indicator to go by (with US AQI being a number aggregated from the several main pollutants found in the air, along with PM2.5 and PM10, the two main particle pollutants), figures of 17 were recorded, indicating a 'good' level of air quality, the best one that can be achieved. This is color-coded as green and requires a US AQI reading of 0 to 50 to be classified as such. Whilst this is another indicatory that Bang Sao Thong can have much cleaner days over the course of the year, these can be subject to rapid change, particularly as the end of the year draws closer, with September through to October often showing a drastic change in pollution levels, not exclusive to Bang Sao Thong but highly prominent in many cities in Thailand. Other US AQI readings present were ones such as 54 and 75, placing Bang Sao Thong into the 'moderate' air quality rating bracket for the days in which they were taken.
Causes of air pollution in Bang Sao Thong range from the ones typically seen throughout the rest of Thailand to ones that are more localized in certain areas. Based on data recorded over the course of 2020, it can be seen, however, that one of the main polluting issues that the country has to deal with does not affect Bang Sao Thong as prevalently as other regions, particularly of those to the northern side of the country. This issue is of course that of slash and burn farming practices, or the open burning of vast swathes of forest and farmland, which leads to many tons of organic matter being poorly combusted thus leaking huge quantities of pollutants and damaging particles into the air. As mentioned, this was not as prominent in Bang Sao Thong, but traces of it affecting the air quality levels were indeed picked up during the burning season period, which typically starts at the end of the year around September or October, and causes elevated levels of pollution to continue well into the earlier months of the following year, with these early months often having the highest levels of air pollution. Some PM2.5 figures from 2020 will be cited at the end of the article, so that readers may get a more concise understanding of when air pollution levels occur, and thus what they can do to prevent the highly negative health issues that come along with it.
Other prominent causes of air pollution that occur in Bang Sao Thong include fumes and exhaust emissions from cars, motorbikes and many other smaller personal vehicles in use throughout the roads, as well as emitted from farming equipment or heavy machinery used in factories, industrial sites and construction areas. The overuse of vehicles (as well as the increasing instances of vehicle ownership, both in Thailand and throughout the world) can also lead to many tons of microscopic rubber particles being deposited into the atmosphere, as well as landing on bodies of water or contaminating the soil, thus affecting animals and various ecosystems in natural habitats directly outside of city centers. Further pollution sources include ultrafine particles given off from the aforementioned construction sites, with poorly maintained ones in particular giving off the largest amounts. Improperly handled accumulations of concrete dust or other industrial waste can lead to it being swept up by the wind and blown away to other areas where it can affect the health of citizens, with uncovered sand piles also contributing to this. Aged vehicles also have a tendency to contribute considerably towards various pollution types, with the poor combustion process in aged motors (often combined with lower quality fuels in rural areas) leading to larger amounts of noxious oil vapors being given off, along with higher amounts of particulate matter and chemical compounds such as nitrogen dioxide, carbon monoxide and sulfur dioxide. Ozone is also a prominent secondary pollutant that forms as a result of primary pollutants being exposed to solar radiation (usually taking places on roads where they accumulate through excessive vehicle usage) and undergoing a reaction whereby ozone, or smog as it is more commonly known, is created. This can cause some ill health effects, which will be discussed in further detail in the following question.
Health problems that can occur when exposed to higher levels of ozone or other ground-level pollutants include nausea, headaches, dizziness as well as irritation to the skin and respiratory tract. Instances of cancer can go up considerably, particularly that of the lungs due to it being constantly exposed to carcinogenic particles (along with skin cancer also making itself present, but less prominently than that of lung cancer). Strokes, alterations to the nervous system, heart attacks, arrhythmias and premature death can all occur when pollution exposure takes place over extended periods of time.
Looking at the data from 2020, it can be seen that Bang Sao Thong had its highest PM2.5 readings in the months of January through to April, with January and February having the highest readings at 32.1 μg/m³ and 37.4 μg/m³ respectively. This placed February into the 'unhealthy for sensitive groups' rating bracket, the only month of the year to achieve this more hazardous air quality ranking.
The most optimal levels of air quality were seen surprisingly in both September (a common theme in Thailand) as well as the month of October, a time in which the air quality levels start to worsen rapidly. Their respective readings were 9.9 μg/m³ and 10.8 μg/m³, placing September into the World Health Organization's (WHO's) target goal of 10 μg/m³ or less for the most optimal quality of air, and the only month of the year to do so.
6Contributors
Government Contributor
1 station
Non-profit organization Contributor
1 station
2 Educational Contributors
1 station
1 station
Corporate Contributor
1 station
Anonymous Contributor
1 station
3 Data sources
 Data validated and calibrated by IQAir