Get a monitor and contributor to air quality data in your city.

1.9K people follow this city


AIR QUALITY DATA CONTRIBUTORS
Central Pollution Control Board
See all

| Weather | Clear sky |
| Temperature | 96.8°F |
| Humidity | 11% |
| Wind | 4.2 mp/h |
| Pressure | 29.7 Hg |
| # | city | US AQI |
|---|---|---|
| 1 |  Noida, Uttar Pradesh Noida, Uttar Pradesh | 369 |
| 2 | Faridabad, Haryana | 213 |
| 3 | Patna, Bihar | 199 |
| 4 | Kanpur, Uttar Pradesh | 195 |
| 5 | Lucknow, Uttar Pradesh | 187 |
| 6 | Delhi, Delhi | 184 |
| 7 | Moradabad, Uttar Pradesh | 177 |
| 8 | Gurugram, Haryana | 175 |
| 9 | New Delhi, Delhi | 174 |
| 10 | Ghaziabad, Uttar Pradesh | 169 |
(local time)
SEE WORLD AQI RANKING
| # | station | US AQI |
|---|---|---|
| 1 | Moti Doongri, Alwar, Rajasthan - RSPCB | 161 |
(local time)
SEE WORLD AQI RANKING
US AQI
155
live AQI index
Unhealthy

| Air pollution level | Air quality index | Main pollutant |
|---|---|---|
| Unhealthy | 155 US AQI | PM2.5 |
| Pollutants | Concentration | |
|---|---|---|
| PM2.5 | 61.7µg/m³ | |
| PM10 | 116.7µg/m³ | |
| O3 | 28.5µg/m³ | |
| NO2 | 48.9µg/m³ | |
| SO2 | 16.9µg/m³ | |
| CO | 1590µg/m³ | |
PM2.5
x12.3
PM2.5 concentration in Alwar is currently 12.3 times the WHO annual air quality guideline value
 | Avoid outdoor exercise |
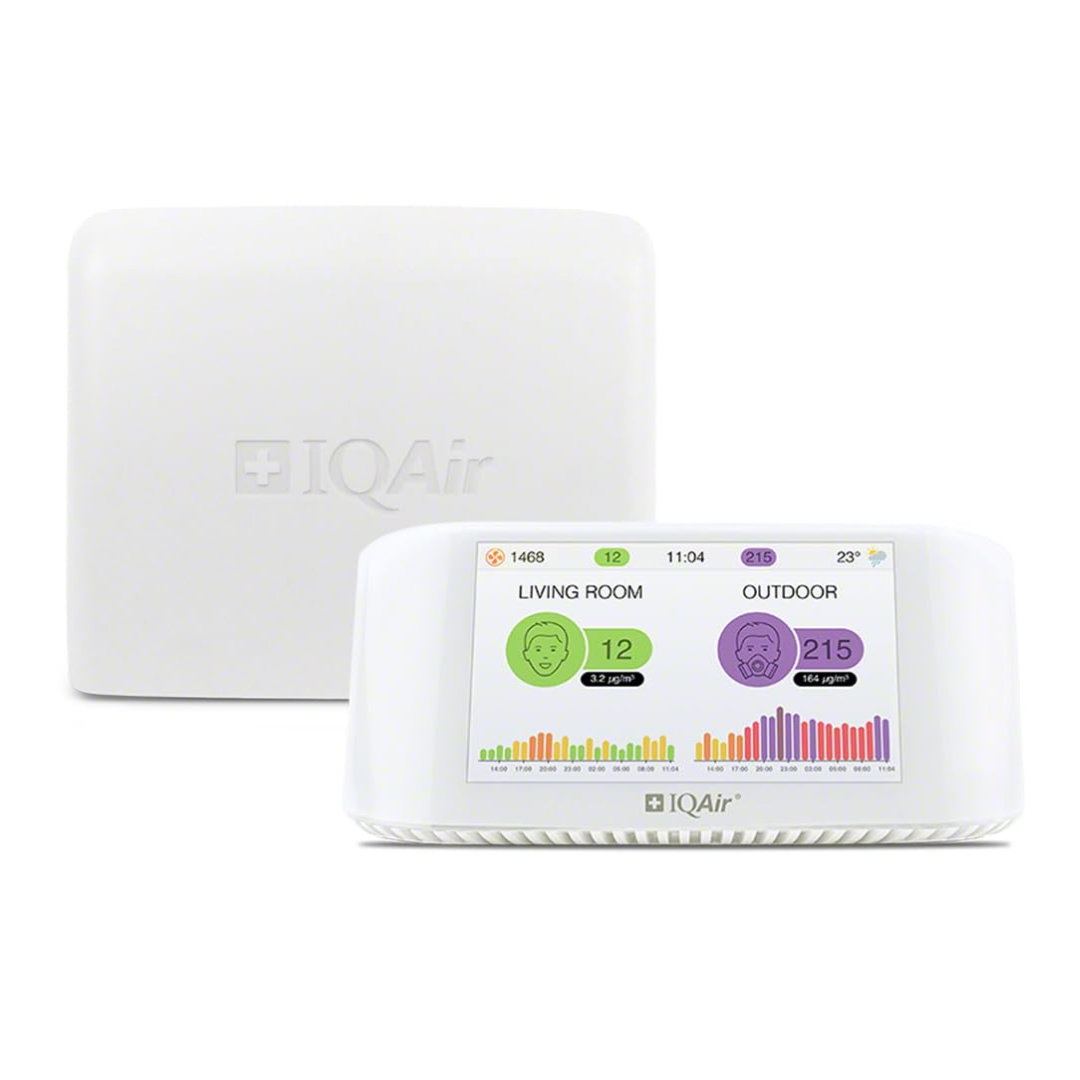
 | Close your windows to avoid dirty outdoor air GET A MONITOR |
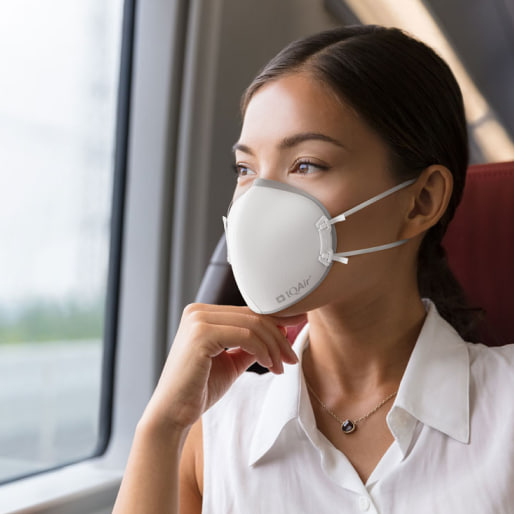
 | Wear a mask outdoors GET A MASK |
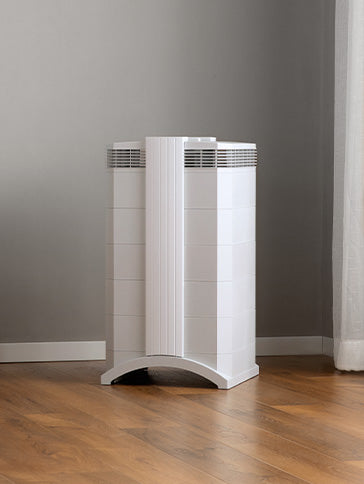
 | Run an air purifier GET AN AIR PURIFIER |
| Day | Pollution level | Weather | Temperature | Wind |
|---|---|---|---|---|
| Tuesday, May 14 | Unhealthy for sensitive groups 131 AQI US  | 105.8° 84.2° | ||
| Wednesday, May 15 | Unhealthy for sensitive groups 138 AQI US | 107.6° 84.2° | ||
| Thursday, May 16 | Unhealthy for sensitive groups 149 AQI US | 109.4° 87.8° | ||
| Today | Unhealthy 155 AQI US | 113° 89.6° | ||
| Saturday, May 18 | Moderate 97 AQI US  | 114.8° 89.6° | ||
| Sunday, May 19 | Unhealthy for sensitive groups 132 AQI US | 114.8° 93.2° | ||
| Monday, May 20 | Moderate 91 AQI US | 113° 91.4° | ||
| Tuesday, May 21 | Unhealthy for sensitive groups 113 AQI US | 111.2° 93.2° | ||
| Wednesday, May 22 | Unhealthy for sensitive groups 116 AQI US | 113° 98.6° | ||
| Thursday, May 23 | Unhealthy 151 AQI US | 116.6° 93.2° |
Interested in hourly forecast? Get the app
News
The latest air quality news and resources.
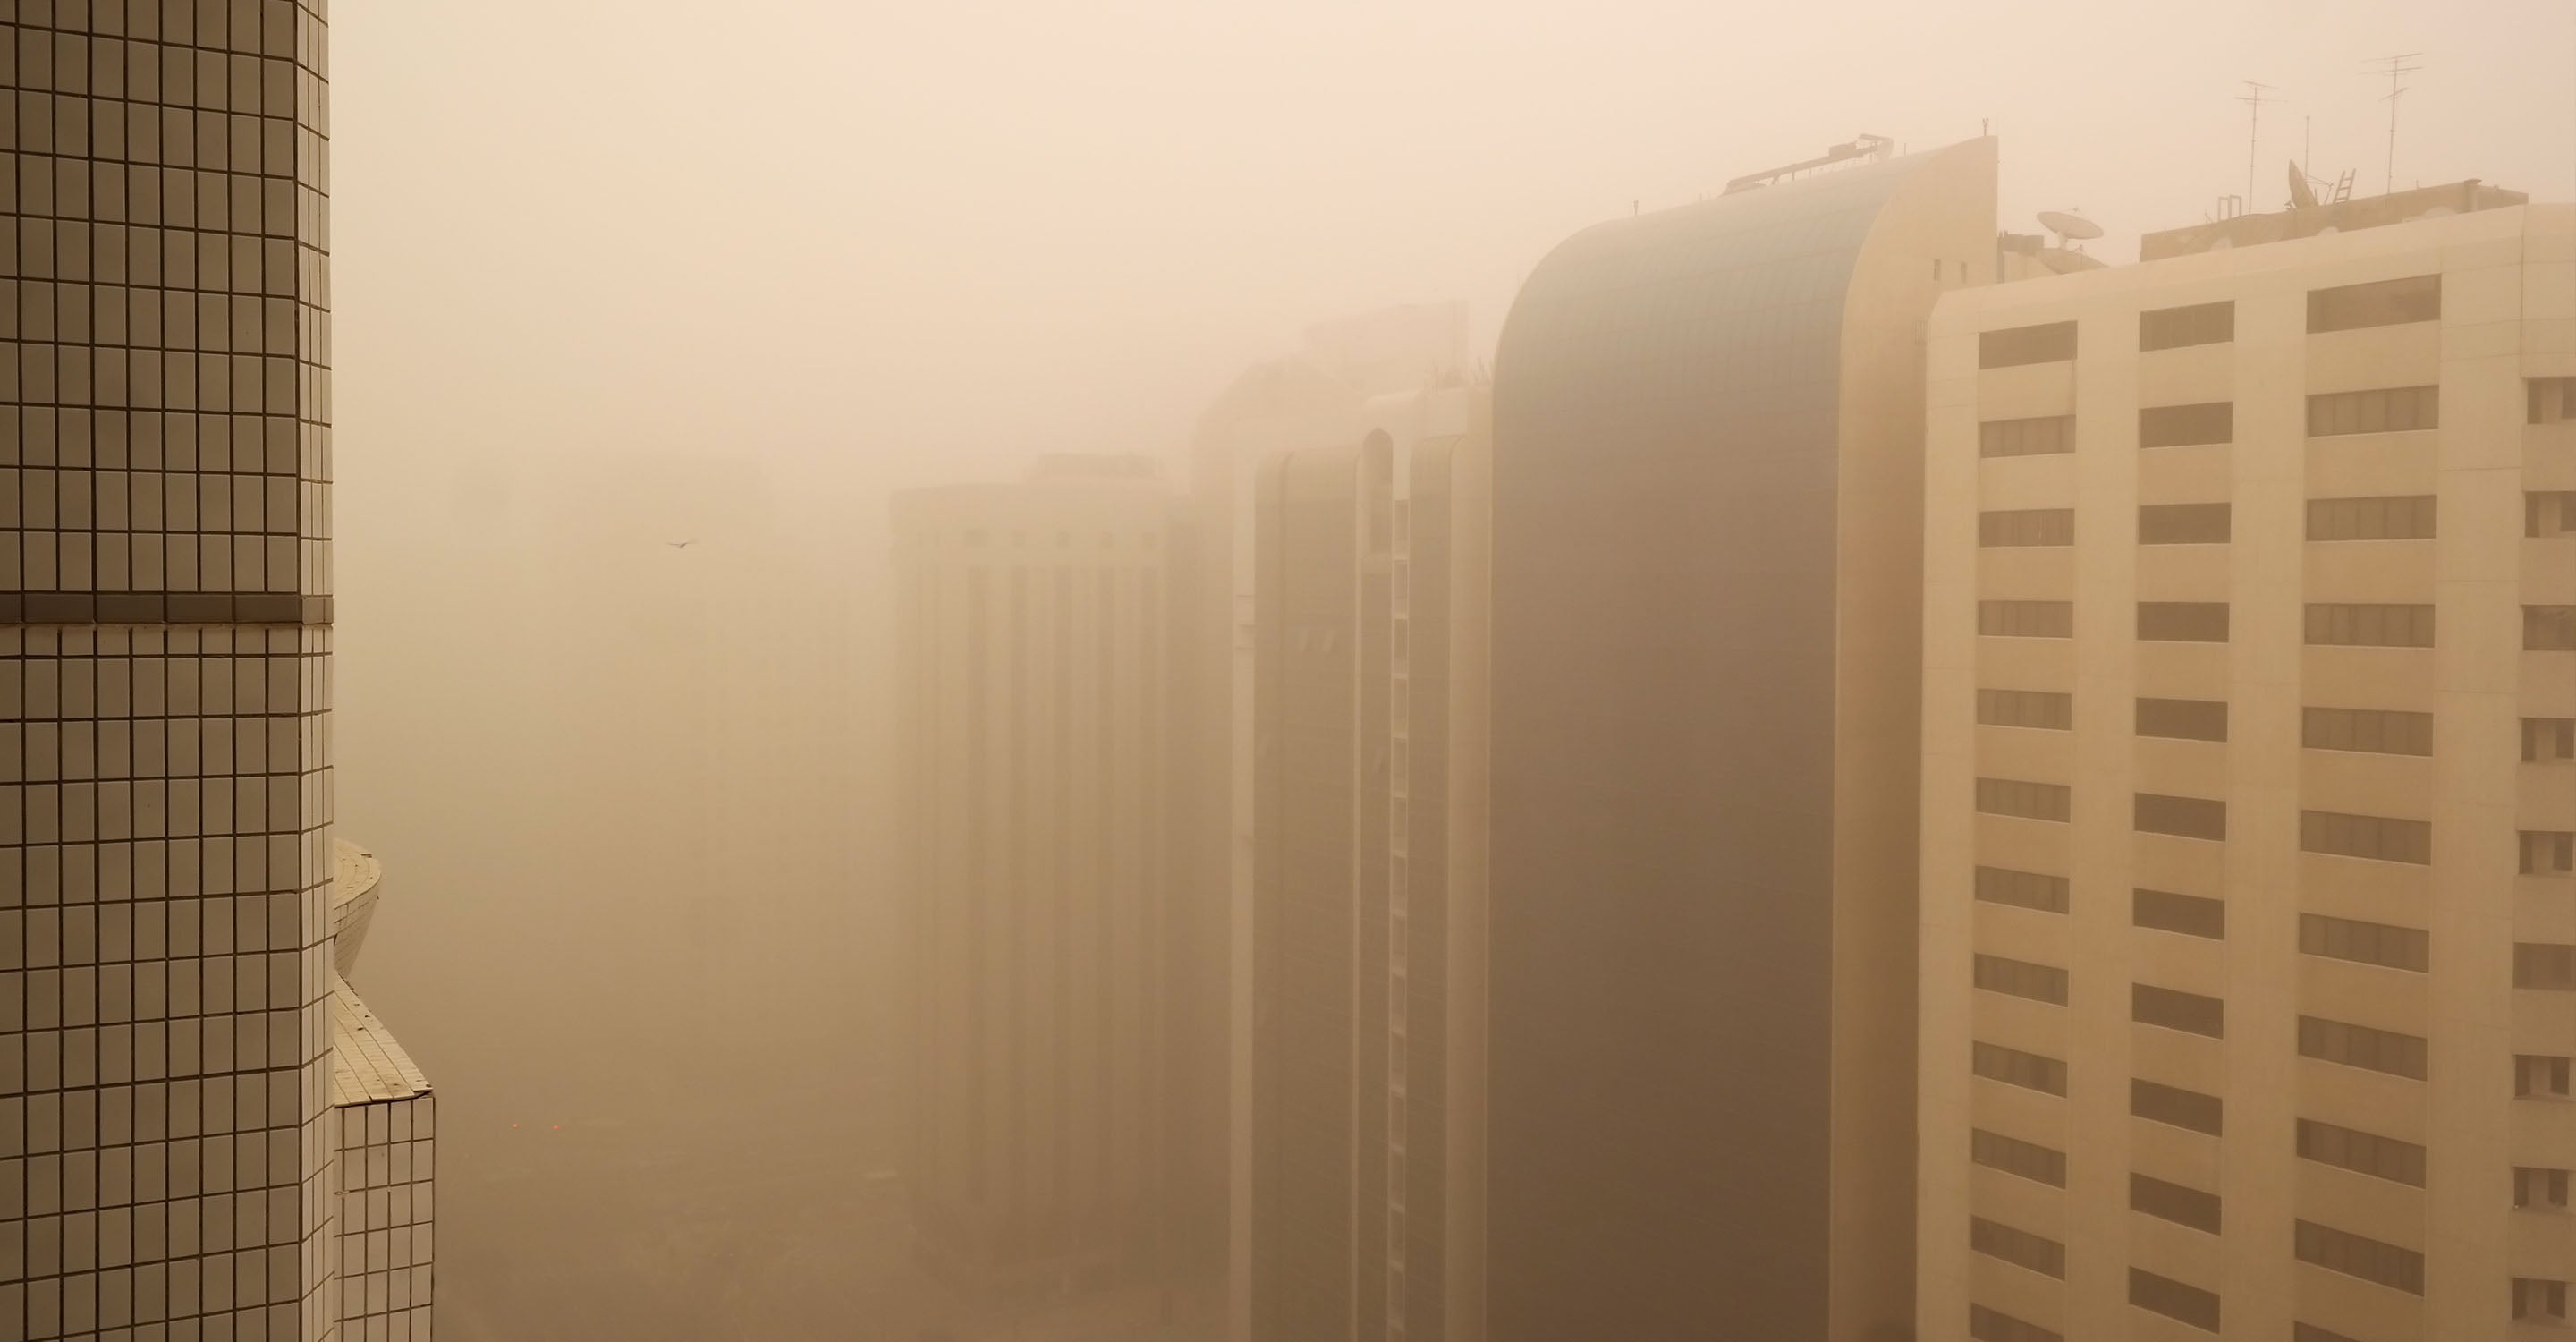
Alwar is a city located in the national capital region of India, having a close proximity to many other major cities such as Delhi and Jaipur. It is situated within Rajasthan state, which itself suffers from many air pollution related issues, that can also be witnessed in the aforementioned neighboring cities.
In May of 2021, Alwar was seen with a US AQI reading of 75, placing it within the ‘moderate’ air quality ranking in that particular day and time in which it was taken. As the name indicates, Alwar would see a moderate amount of pollutants filling the air, and whilst this is nowhere near as detrimental as some of the months on record in both 2021 and 2020, it still may present some issues for those who are particularly at risk when it comes to pollution exposure.
This effect is made more apparent when exposure levels are maintained over long periods of time, which may be a daily occurrence for those that live near busy roads, industrial zones or others that have to commute through areas of heavy traffic.
The US AQI used in reference above is itself a composite number, calculated from the various pollutants found in the air. Some of these are ones such as ozone (O3), nitrogen dioxide (NO2) and sulfur dioxide (SO2), as well as the two main types of particulate matter, PM2.5 and PM10.
PM2.5 is significantly more harmful to the health of people who breathe it, due to its extremely small size, as well as the variety of dangerous materials that it can comprised of. Due to its size, it can penetrate deep into the lung tissue, entering the bloodstream via the alveoli, or small air sacs, and from there enter into many far reaches of the body, causing a variety of ailments, some of which will be discussed at the end of the article.
PM2.5 is also used as a measure of pollution in its own right, often used to calculate yearly averages. Looking at the yearly average of Alwar as taken over 2020, it can be seen that the city came in with a PM2.5 reading of 41.1 μg/m³. This placed it into the ‘unhealthy for sensitive groups’ bracket, which requires a PM2.5 reading of anywhere between 35.5 to 55.4 μg/m³ to be classified as such. This would present a great deal of harm to vulnerable groups within the population, and its reading of 41.1 μg/m³ placed it in 74th place out of all cities ranked in India over the course of 2020, as well as 182nd place out of all cities ranked worldwide in the same year.
The main sources of air pollution in Alwar would be ones such as vehicle fumes and emissions, as well as smoke and haze given off by factories and power plants, all of which can utilize fossil fuels such as natural gas, diesel and coal.
Construction sites and other similar areas can all give off large amounts of hazardous particles, and the use of raw materials such as dried animal dung, firewood and charcoal also contribute massively to the pollution levels seen on record (although these practices are far more common within lower income districts, as well as rural areas).
In contrast to many cities throughout India, Alwar does not have a period of time in which the pollution levels rise to exceedingly high numbers. Rather, it maintains high readings throughout the year, with a somewhat relentless level of air pollution.
Out of all of these, the months that did come in with the highest levels of PM2.5 in 2020 were January and February, as well as September through to December. In monthly order, their readings were 43.2 μg/m³, 44.9 μg/m³, 41.4 μg/m³, 51 μg/m³, 48.5 μg/m³ and 47.4 μg/m³. This made October the most polluted month of the year with its reading of 51 μg/m³.
Once again observing the data collected over the course of 2020, the months that had the cleanest levels of air quality were the sparingly placed and somewhat sporadic months of April and August, which presented with PM2.5 readings of 28.7 μg/m³ and 34.3 μg/m³ respectively.
This goes to show that the air quality in Alwar, going off of the readings in 2020, does not really see a clear cut period of time in which the pollution level drops, and stays down, which is of great detriment to its citizens due to the extended, year round ambient levels of air pollution remaining high. Nevertheless, both April and August were the cleanest months and both fell into the ‘moderate’ ratings bracket, which requires a reading of 12.1 to 35.4 μg/m³ to be classified as such. Out of the two, April had the best reading at 28.7 μg/m³, making it the least polluted month of the year.
Further health problems that individuals may encounter when breathing excessive amounts of pollution in Alwar would be mostly linked to the pulmonary and cardiac system, although many other ailments across a range of different organs are possible. Skin damage can occur, as well as irritation or aggravation of the mucous membranes, with the mouth, eyes, ears and nose all being vulnerable to chemical irritants. Skin can experience breakouts of acne, atopic dermatitis and a number of other rashes depending on the individual and what they have been exposed to. On a more serious note, skin cancer is also known to be a heightened risk for those that are repeatedly exposed to carcinogenic or mutagenic materials.
When inhaled, these materials can also cause cancer of the lungs, as well as spreading via the blood stream to other areas of the body. This can cause the filtration units of the body, namely the liver and kidneys, to experience some damage, leading to a host of further complications down the line. Rates of heart attacks can go up, along with other dangerous conditions such as ischemic heart disease, strokes, arrythmias and all manner of respiratory related issues.
Some of these would be ones such as pneumonia and bronchitis, as well as the many other illnesses that fall under the chronic obstructive pulmonary disease (COPD) bracket. Repeated scarring or inflammation of the lungs can occur when irritants are introduced, which can lead to higher rates of the above mentioned conditions, as well as a reduction in full lung capacity and function.
1Contributor
Government Contributor
1 station
1 Data source