Get a monitor and contributor to air quality data in your city.

1.9K people follow this city


AIR QUALITY DATA CONTRIBUTORS
Central Pollution Control Board
See all

| Weather | Scattered clouds |
| Temperature | 82.4°F |
| Humidity | 51% |
| Wind | 3.4 mp/h |
| Pressure | 30 Hg |
| # | city | US AQI |
|---|---|---|
| 1 |  Delhi, Delhi Delhi, Delhi | 276 |
| 2 | New Delhi, Delhi | 268 |
| 3 | Mumbai, Maharashtra | 165 |
| 4 | Jaipur, Rajasthan | 106 |
| 5 | Raipur, Chhattisgarh | 104 |
| 6 | Hyderabad, Telangana | 102 |
| 7 | Gharghoda, Chhattisgarh | 83 |
| 8 | Jabalpur, Madhya Pradesh | 81 |
| 9 | Cuddalore, Tamil Nadu | 79 |
| 10 | Jodhpur, Rajasthan | 72 |
(local time)
SEE WORLD AQI RANKING
| # | station | US AQI |
|---|---|---|
| 1 | Sector-2 Industrial Area, Pithampur - MPPCB | 146 |
(local time)
SEE WORLD AQI RANKING
US AQI
146
live AQI index
Unhealthy for sensitive groups

| Air pollution level | Air quality index | Main pollutant |
|---|---|---|
| Unhealthy for sensitive groups | 146 US AQI | PM2.5 |
| Pollutants | Concentration | |
|---|---|---|
| PM2.5 | 54µg/m³ | |
| PM10 | 103µg/m³ | |
| O3 | 23.7µg/m³ | |
| NO2 | 19.8µg/m³ | |
| SO2 | 8.7µg/m³ | |
| CO | 1000µg/m³ | |
PM2.5
x10.8
PM2.5 concentration in Pithampur is currently 10.8 times the WHO annual air quality guideline value
 | Reduce outdoor exercise |
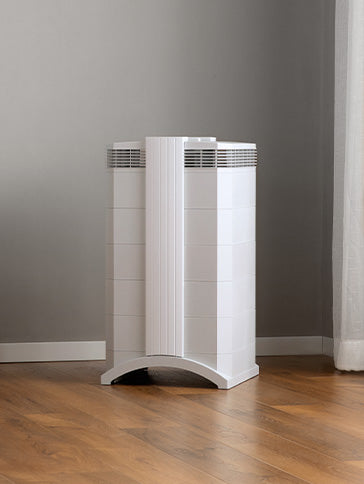
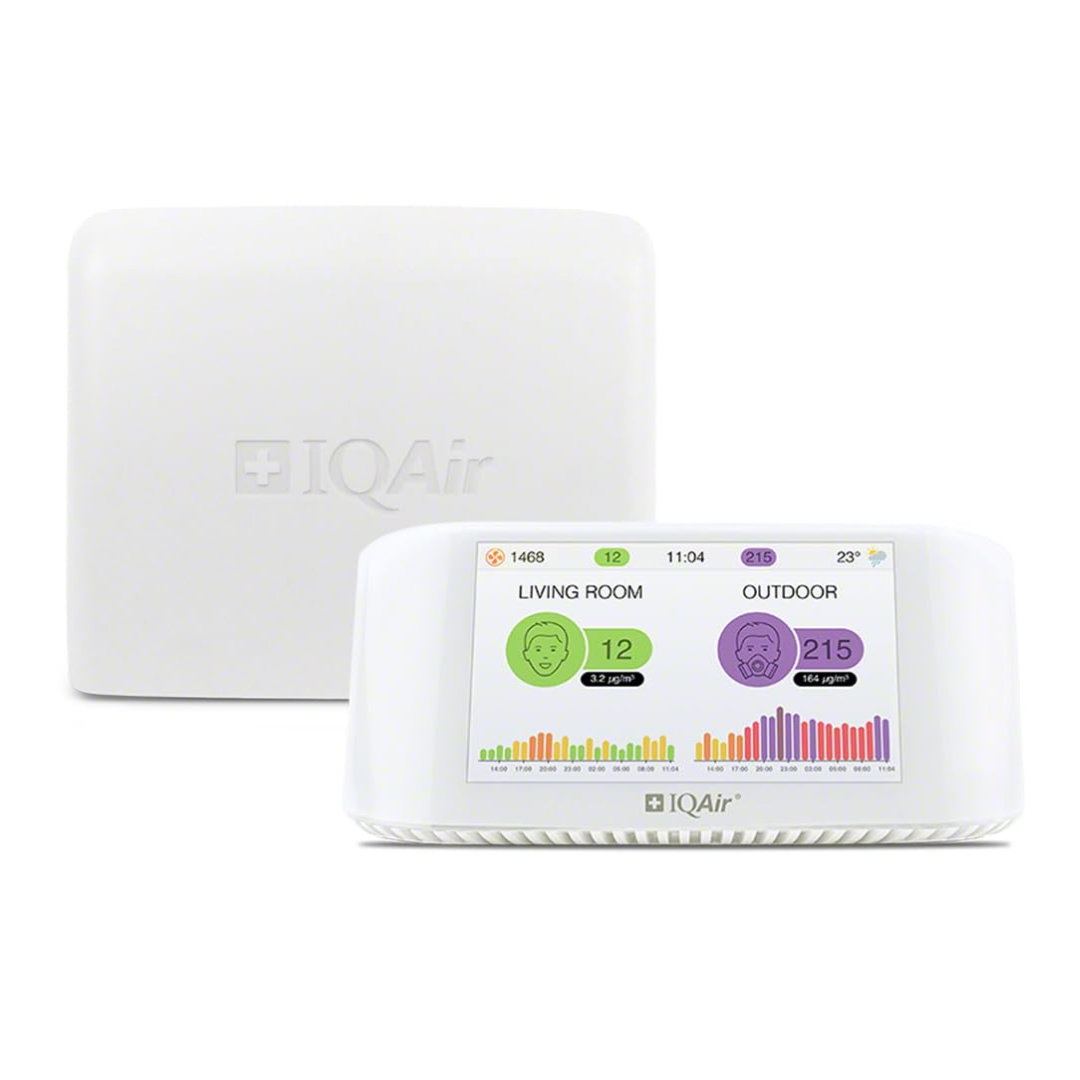
 | Close your windows to avoid dirty outdoor air GET A MONITOR |
 | Sensitive groups should wear a mask outdoors GET A MASK |
 | Run an air purifier GET AN AIR PURIFIER |
| Day | Pollution level | Weather | Temperature | Wind |
|---|---|---|---|---|
| Today | Unhealthy for sensitive groups 146 AQI US | 98.6° 80.6° | ||
| Wednesday, May 15 | Moderate 84 AQI US  | 102.2° 82.4° | ||
| Thursday, May 16 | Moderate 84 AQI US | 104° 84.2° | ||
| Friday, May 17 | Moderate 84 AQI US | 102.2° 86° | ||
| Saturday, May 18 | Moderate 80 AQI US | 95° 84.2° | ||
| Sunday, May 19 | Moderate 79 AQI US | 100.4° 78.8° | ||
| Monday, May 20 | Moderate 80 AQI US | 100.4° 82.4° |
Interested in hourly forecast? Get the app
News
The latest air quality news and resources.
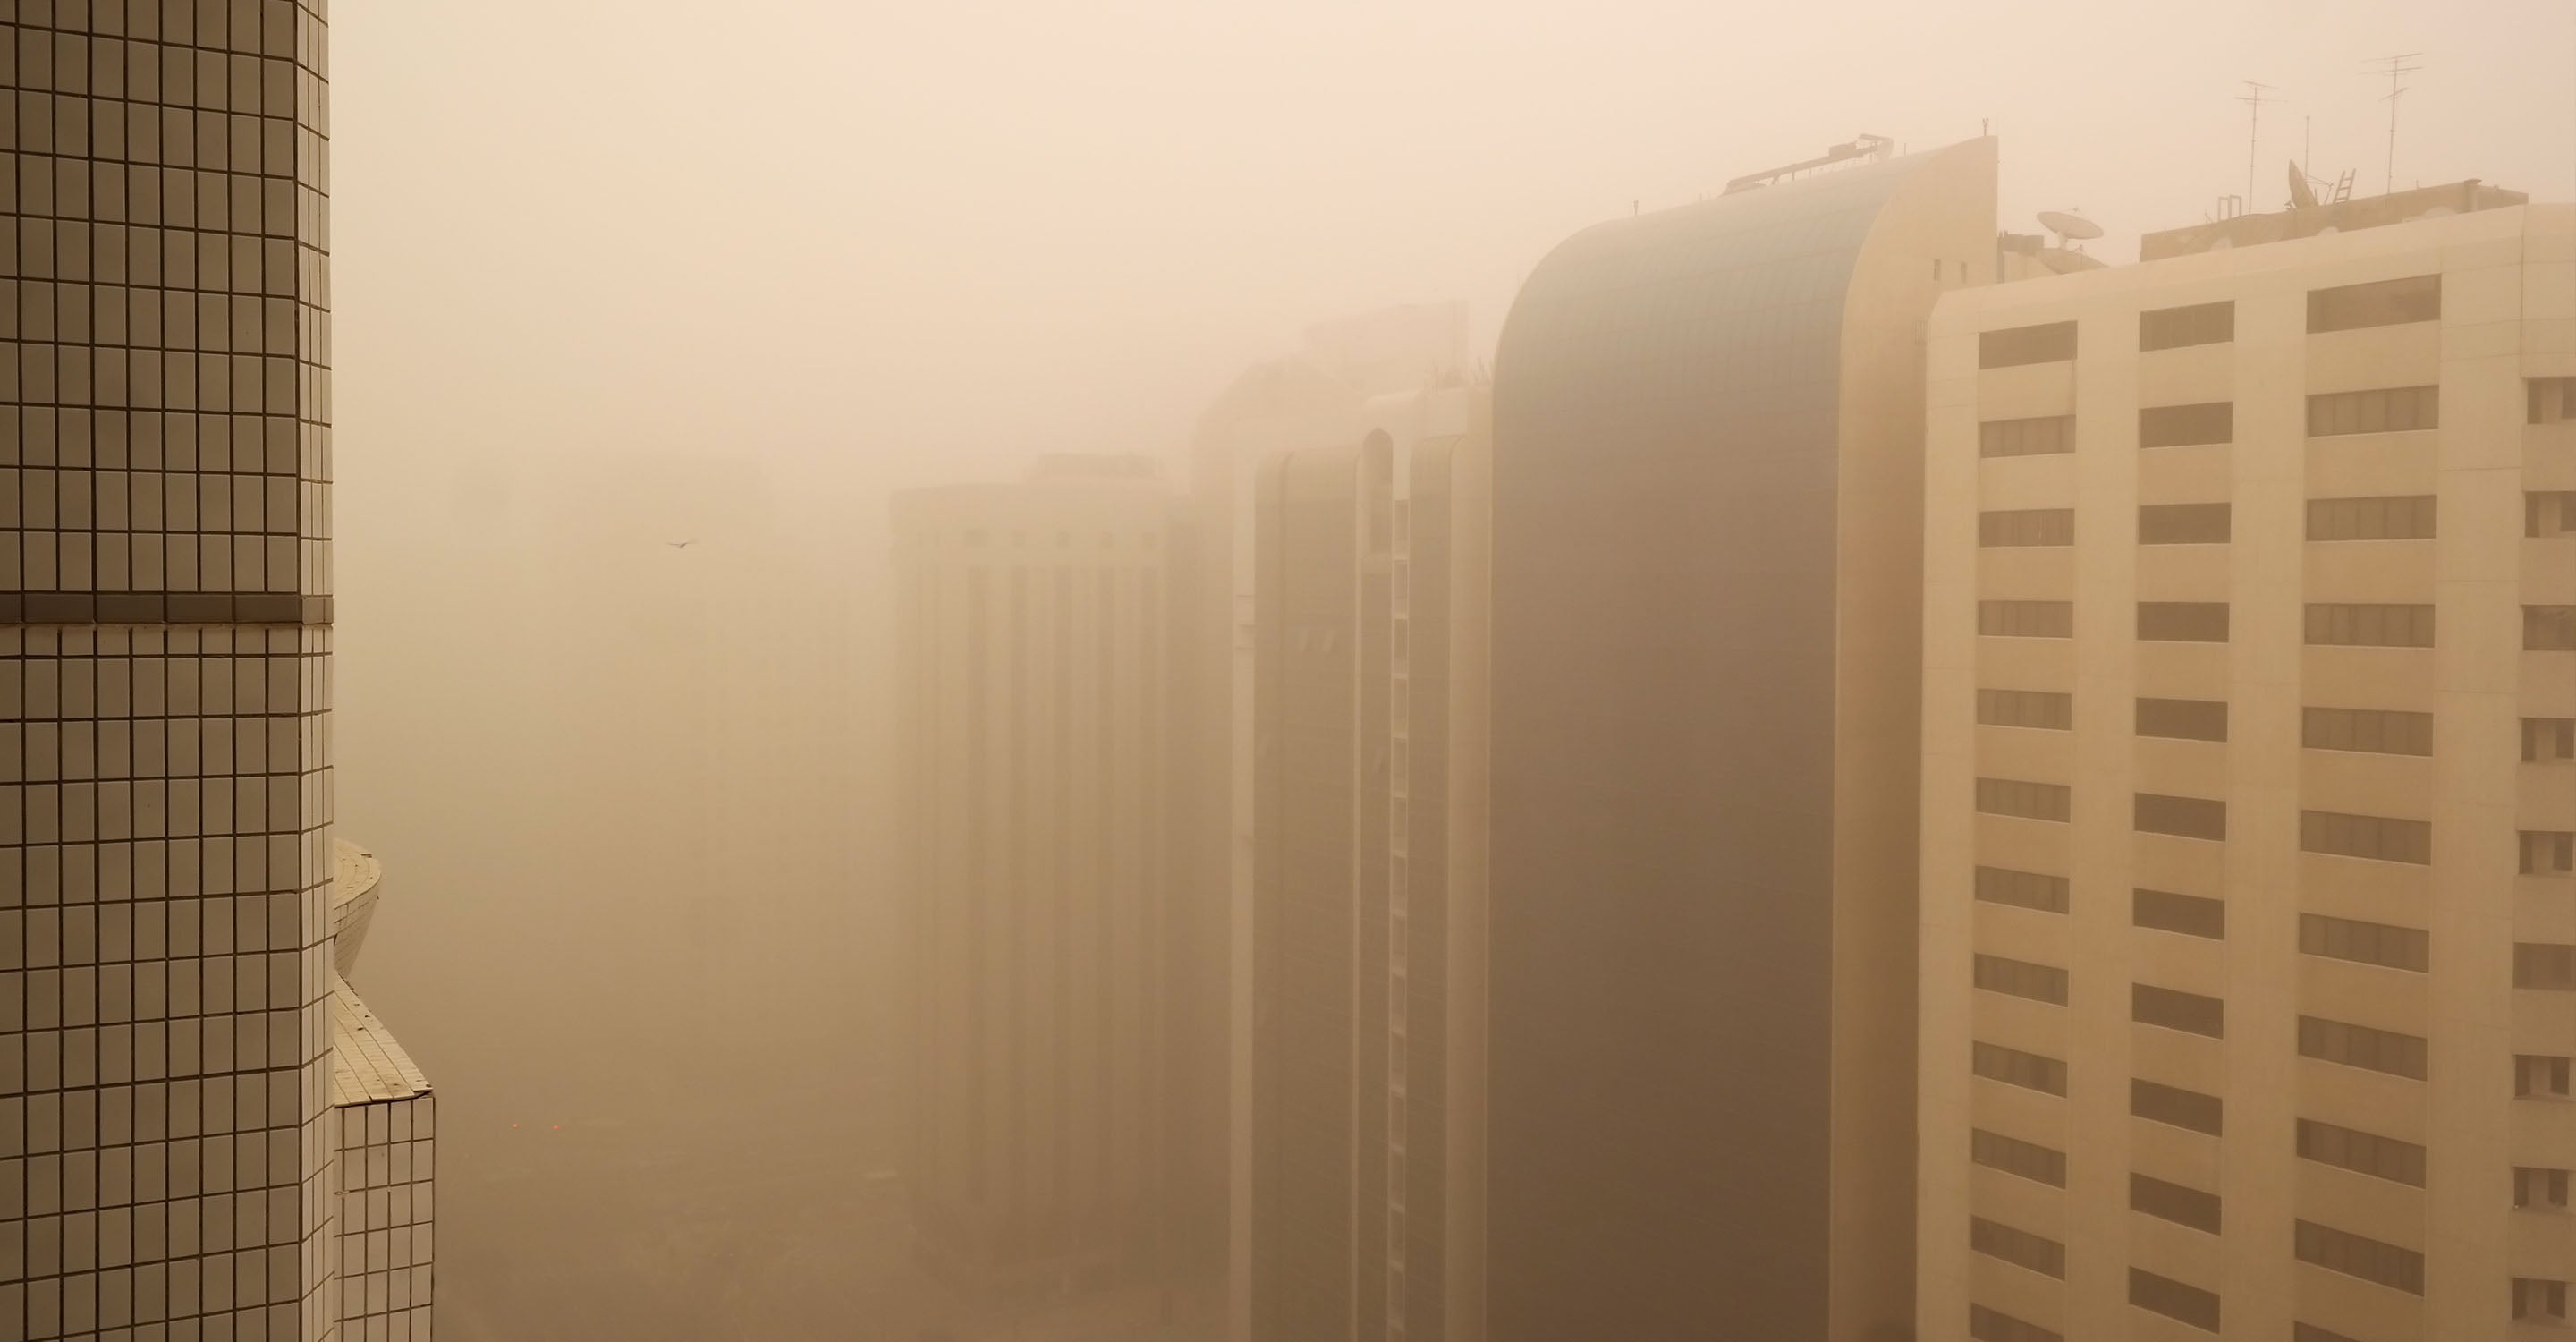
Pithampur is a town in the Dhar district of Madhya Pradesh, India. Pithampur is an industrial city, and is a part of the Indore Metropolitan Region. It is the base for many large industries. A census conducted in 2011 estimated its population to be approximately 127,000 people, though this will have increased since then.
In May 2021, Pithampur was going through a period of air quality that can be described as “Moderate” with a US AQI figure of 67. This classification follows the procedures as suggested by the World Health Organisation (WHO). It is a globally recognised set of metrics that is used when comparing air quality in different cities across the world. In order to determine this level, there are up to six of the most prevalent pollutants which are measured. If all six figures are unavailable, then the level is calculated by using what figures are available. In the case of Pithampur, only three figures were used to evaluate the air quality.
The three pollutants used for this calculation were: PM2.5 - 17.4 µg/m³, PM10 - 46 µg/m³ and nitrogen dioxide (NO2) - µg/m³. These figures are quoted in micrograms or microns per cubic metre. With levels such as these, the advice given is to stay inside and close all doors and windows to prevent the ingress of more dirty air into the rooms. Those people of a sensitive disposition should avoid venturing outside whilst the air is of such poor quality. All groups should avoid prolonged periods of strenuous outdoor activity until the situation improves. The table at the top of this page will assist you in your decision.
Looking back at the figures published by IQAir.com for 2020, it can easily be seen that the best time of year for air quality are the summer months. Running from March through until the end of September, Pithampur enjoyed a period of “Moderate” quality air with readings between 12.1 and 35.4 µg/m³. There was a slight rise in the figure for April (the higher the figure; the worse the pollution) which pushed it down into a lower bracket together with January, February and October. Together, these months were classed as “Unhealthy for sensitive groups” with figures between 35.5 and 55.4 µg/m³. The remaining two months of November and December saw another decline in quality when the readings were between 55.5 and 150.4 µg/m³, which is classed as being “Unhealthy”. This should come as no surprise as more coal is used in the colder months to provide heating for homes and businesses.
Historically, records have been kept since 2018 when the level was recorded to be 46.2 µg/m³, the following year showed a slight improvement with a recording of 39.5 µg/m³. Last year however, in 2020 the figure was 40.1 µg/m³. Most cities recorded a much lower than expected figure because of the restrictions imposed because of the COVID-19 pandemic, but Pithampur went back up to 40.1 µg/m³. The air quality improved in most other cities due to the prohibited use of private vehicles and the suspension of production in many factories and similar operations.
Man-made sources include thermal power plants, industrial units, vehicle emissions, burning fossil fuels, agricultural activities, etc. Thermal power plants have become the major source for generating electricity in India, as nuclear power plants could not be installed as planned. The main pollutants emitted are fly ash and sulphur dioxide. Metallurgical plants also consume coal and produce similar pollutants. Fertiliser plants, smelters, textile mills, tanneries, refineries, chemical industries, paper and pulp mills are other sources of air pollution.
Automobile exhaust is another major source of air pollution. Automobiles release gases such as carbon monoxide (about 77 per cent), oxides of nitrogen (about 8 per cent) and hydrocarbons (about 14 per cent). Heavy duty diesel vehicles make more oxides of nitrogen and Suspended Particulate Matter (SPM) than petrol vehicles, which produce more carbon monoxide and hydrocarbons.
Fuels such as coal, dung-cake, wood, and kerosene are used in many homes in under-developed and developing countries, including India. Complete combustion of fuel produces carbon dioxide, which may not be toxic. However, incomplete combustion produces the toxic gas carbon monoxide. Coal contains varying amounts of sulphur, which upon burning produces sulphur dioxide.
Burning fossil fuels produces black soot. These pollutants i.e. carbon monoxide, sulphur dioxide, soot and many others like formaldehyde, benzo- (a) pyrene (BAP) are toxic and harmful to health. BAP is also found in cigarette smoke and is considered a cause of cancer. A housewife using wood as fuel for cooking uses BAP which is equivalent to 20 packets of cigarettes per day.
It is clear that the relevant sectors will have to come forward and take action and motivate all the major sectors that cause pollution. Implement the power plant standards in the state, reduce the use of coal and other polluting fuels used in industries and improve emissions control, promote public transport and improve vehicle restriction measures and zero waste for garbage and to manage and adopt a zero landfill policy.
The use of LPG and advanced biomass cooking and stoves will be encouraged in many commercial spaces such as small restaurants to curb polluting sources like tandoor. Fuel polluting wood, coal or other types of environmentally polluting fuel sources will be completely banned.
Around 93 per cent of children under the age of 15 worldwide. We breathe air which is polluted and this polluted air has a serious impact on the health and development of children. Many of these children die due to these severe effects. The World Health Organisation estimates that 600,000 children died in 2018 from respiratory infections caused by polluted air.
Pregnant women are more likely to give birth prematurely when they are exposed to polluted air, and thus babies born are younger and weighing less at birth. Air pollution also affects brain development and cognitive ability, as well as can cause asthma and childhood cancer. Children who are exposed to high levels of air pollution have a higher risk of heart disease as they age.
1Contributor
Government Contributor
1 station
1 Data source