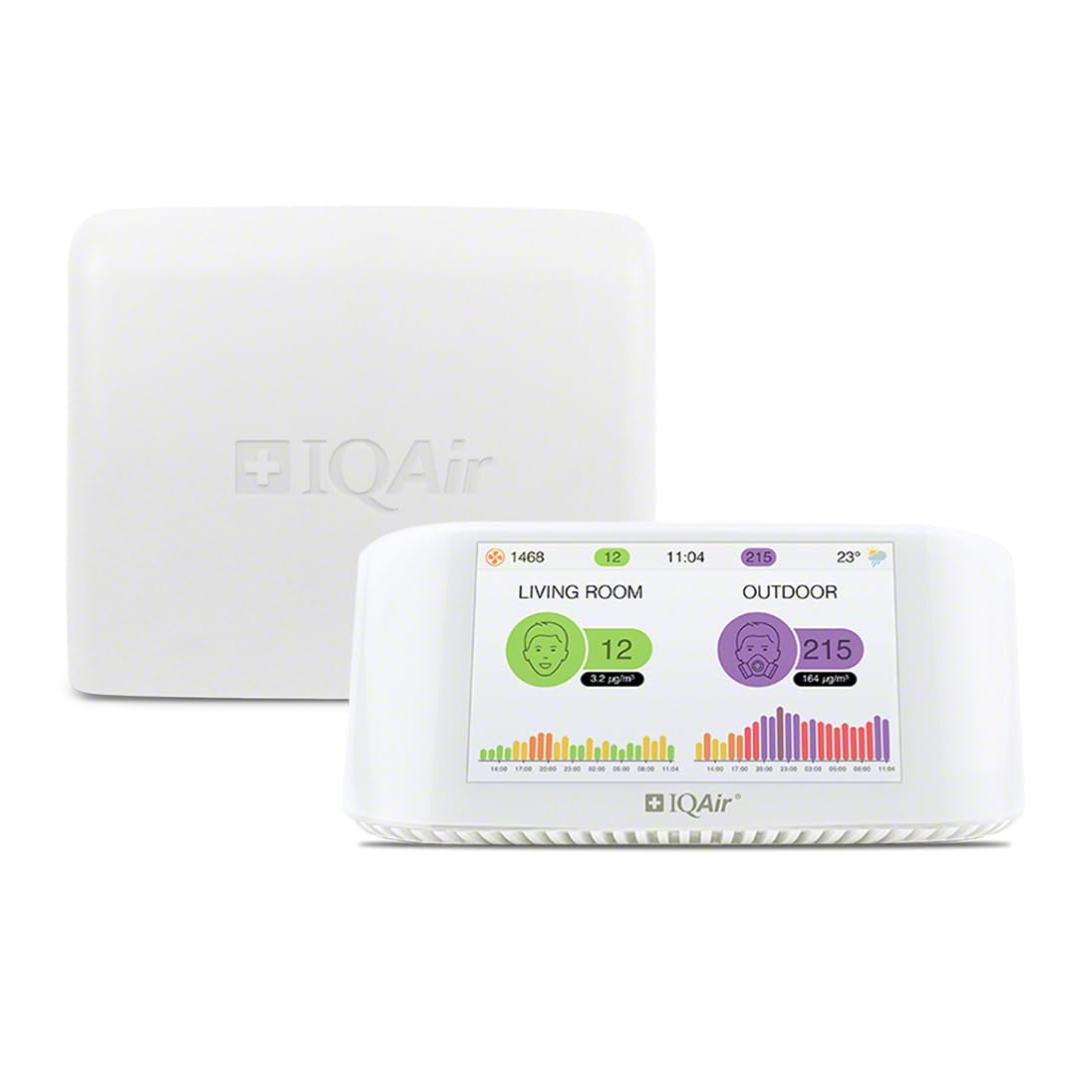
Get a monitor and contributor to air quality data in your city.

666 people follow this city


AIR QUALITY DATA CONTRIBUTORS
2 Contributors
See all

| Index | Very high | ||
| Tree pollen | Very high | ||
| Grass pollen | None | ||
| Weed pollen | None |

| Weather | Clear sky |
| Temperature | 46.4°F |
| Humidity | 73% |
| Wind | 11.5 mp/h |
| Pressure | 30 Hg |
| # | city | US AQI |
|---|---|---|
| 1 |  Lansi-Turunmaa, Finland Proper Lansi-Turunmaa, Finland Proper | 66 |
| 2 | Oulu, Northern Ostrobothnia | 38 |
| 3 | Lahti, Paijanne Tavastia | 37 |
| 4 | Tampere, Pirkanmaa | 36 |
| 5 | Espoo, Uusimaa | 35 |
| 6 | Kuopio, Northern Savonia | 35 |
| 7 | Helsinki, Uusimaa | 30 |
| 8 | Lappeenranta, South Karelia | 24 |
| 9 | Jyvaskyla, Central Finland | 17 |
| 10 | Muonio, Lapland | 2 |
(local time)
SEE WORLD AQI RANKING
| # | station | US AQI |
|---|---|---|
| 1 | Keskusta | 49 |
| 2 | Pyykösjärvi | 38 |
| 3 | Biologintie | 29 |
(local time)
SEE WORLD AQI RANKING
US AQI
38
live AQI index
Good

| Air pollution level | Air quality index | Main pollutant |
|---|---|---|
| Good | 38 US AQI | PM2.5 |
| Pollutants | Concentration | |
|---|---|---|
| PM2.5 | 7µg/m³ | |
| PM10 | 25.7µg/m³ | |
| O3 | 83.9µg/m³ | |
| NO2 | 8µg/m³ | |
PM2.5
x1.4
PM2.5 concentration in Oulu is currently 1.4 times the WHO annual air quality guideline value
 | Enjoy outdoor activities |
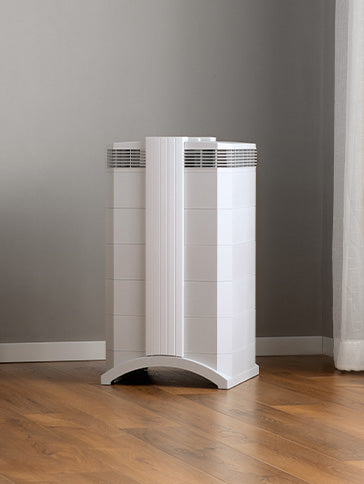
 | Open your windows to bring clean, fresh air indoors GET A MONITOR |
| Day | Pollution level | Weather | Temperature | Wind |
|---|---|---|---|---|
| Sunday, May 12 | Good 31 AQI US | 42.8° 32° | ||
| Monday, May 13 | Good 35 AQI US | 44.6° 35.6° | ||
| Tuesday, May 14 | Good 43 AQI US | 55.4° 37.4° | ||
| Today | Good 38 AQI US | 55.4° 44.6° | ||
| Thursday, May 16 | Good 12 AQI US | 51.8° 37.4° | ||
| Friday, May 17 | Good 14 AQI US | 55.4° 41° | ||
| Saturday, May 18 | Good 44 AQI US | 57.2° 44.6° | ||
| Sunday, May 19 | Moderate 56 AQI US  | 55.4° 42.8° | ||
| Monday, May 20 | Good 40 AQI US | 41° 35.6° | ||
| Tuesday, May 21 | Good 10 AQI US | 41° 32° |
Interested in hourly forecast? Get the app
News
The latest air quality news and resources.
3 Data sources
 Data validated and calibrated by IQAir