Get a monitor and contributor to air quality data in your city.

| # | city | US AQI |
|---|---|---|
| 1 | Fort Erie | 50 |
| 2 | Almonte | 47 |
| 3 | Chatham | 42 |
| 4 | Sarnia | 38 |
| 5 | Hamilton | 35 |
| 6 | Oakville | 34 |
| 7 | Scarborough | 34 |
| 8 | Thunder Bay | 34 |
| 9 | Ottawa | 33 |
| 10 | Sault Ste Marie | 32 |
(local time)
SEE WORLD AQI RANKINGAIR QUALITY DATA CONTRIBUTORS
96 Contributors


See all


News
The latest air quality news and resources.
Ontario air pollution levels are considered low, contributing to a generally “healthy” air quality status. In 2016, 93 percent of cities in the province met Canada’s “very good” or “good” air quality standards, which are among the most stringent in the World.1
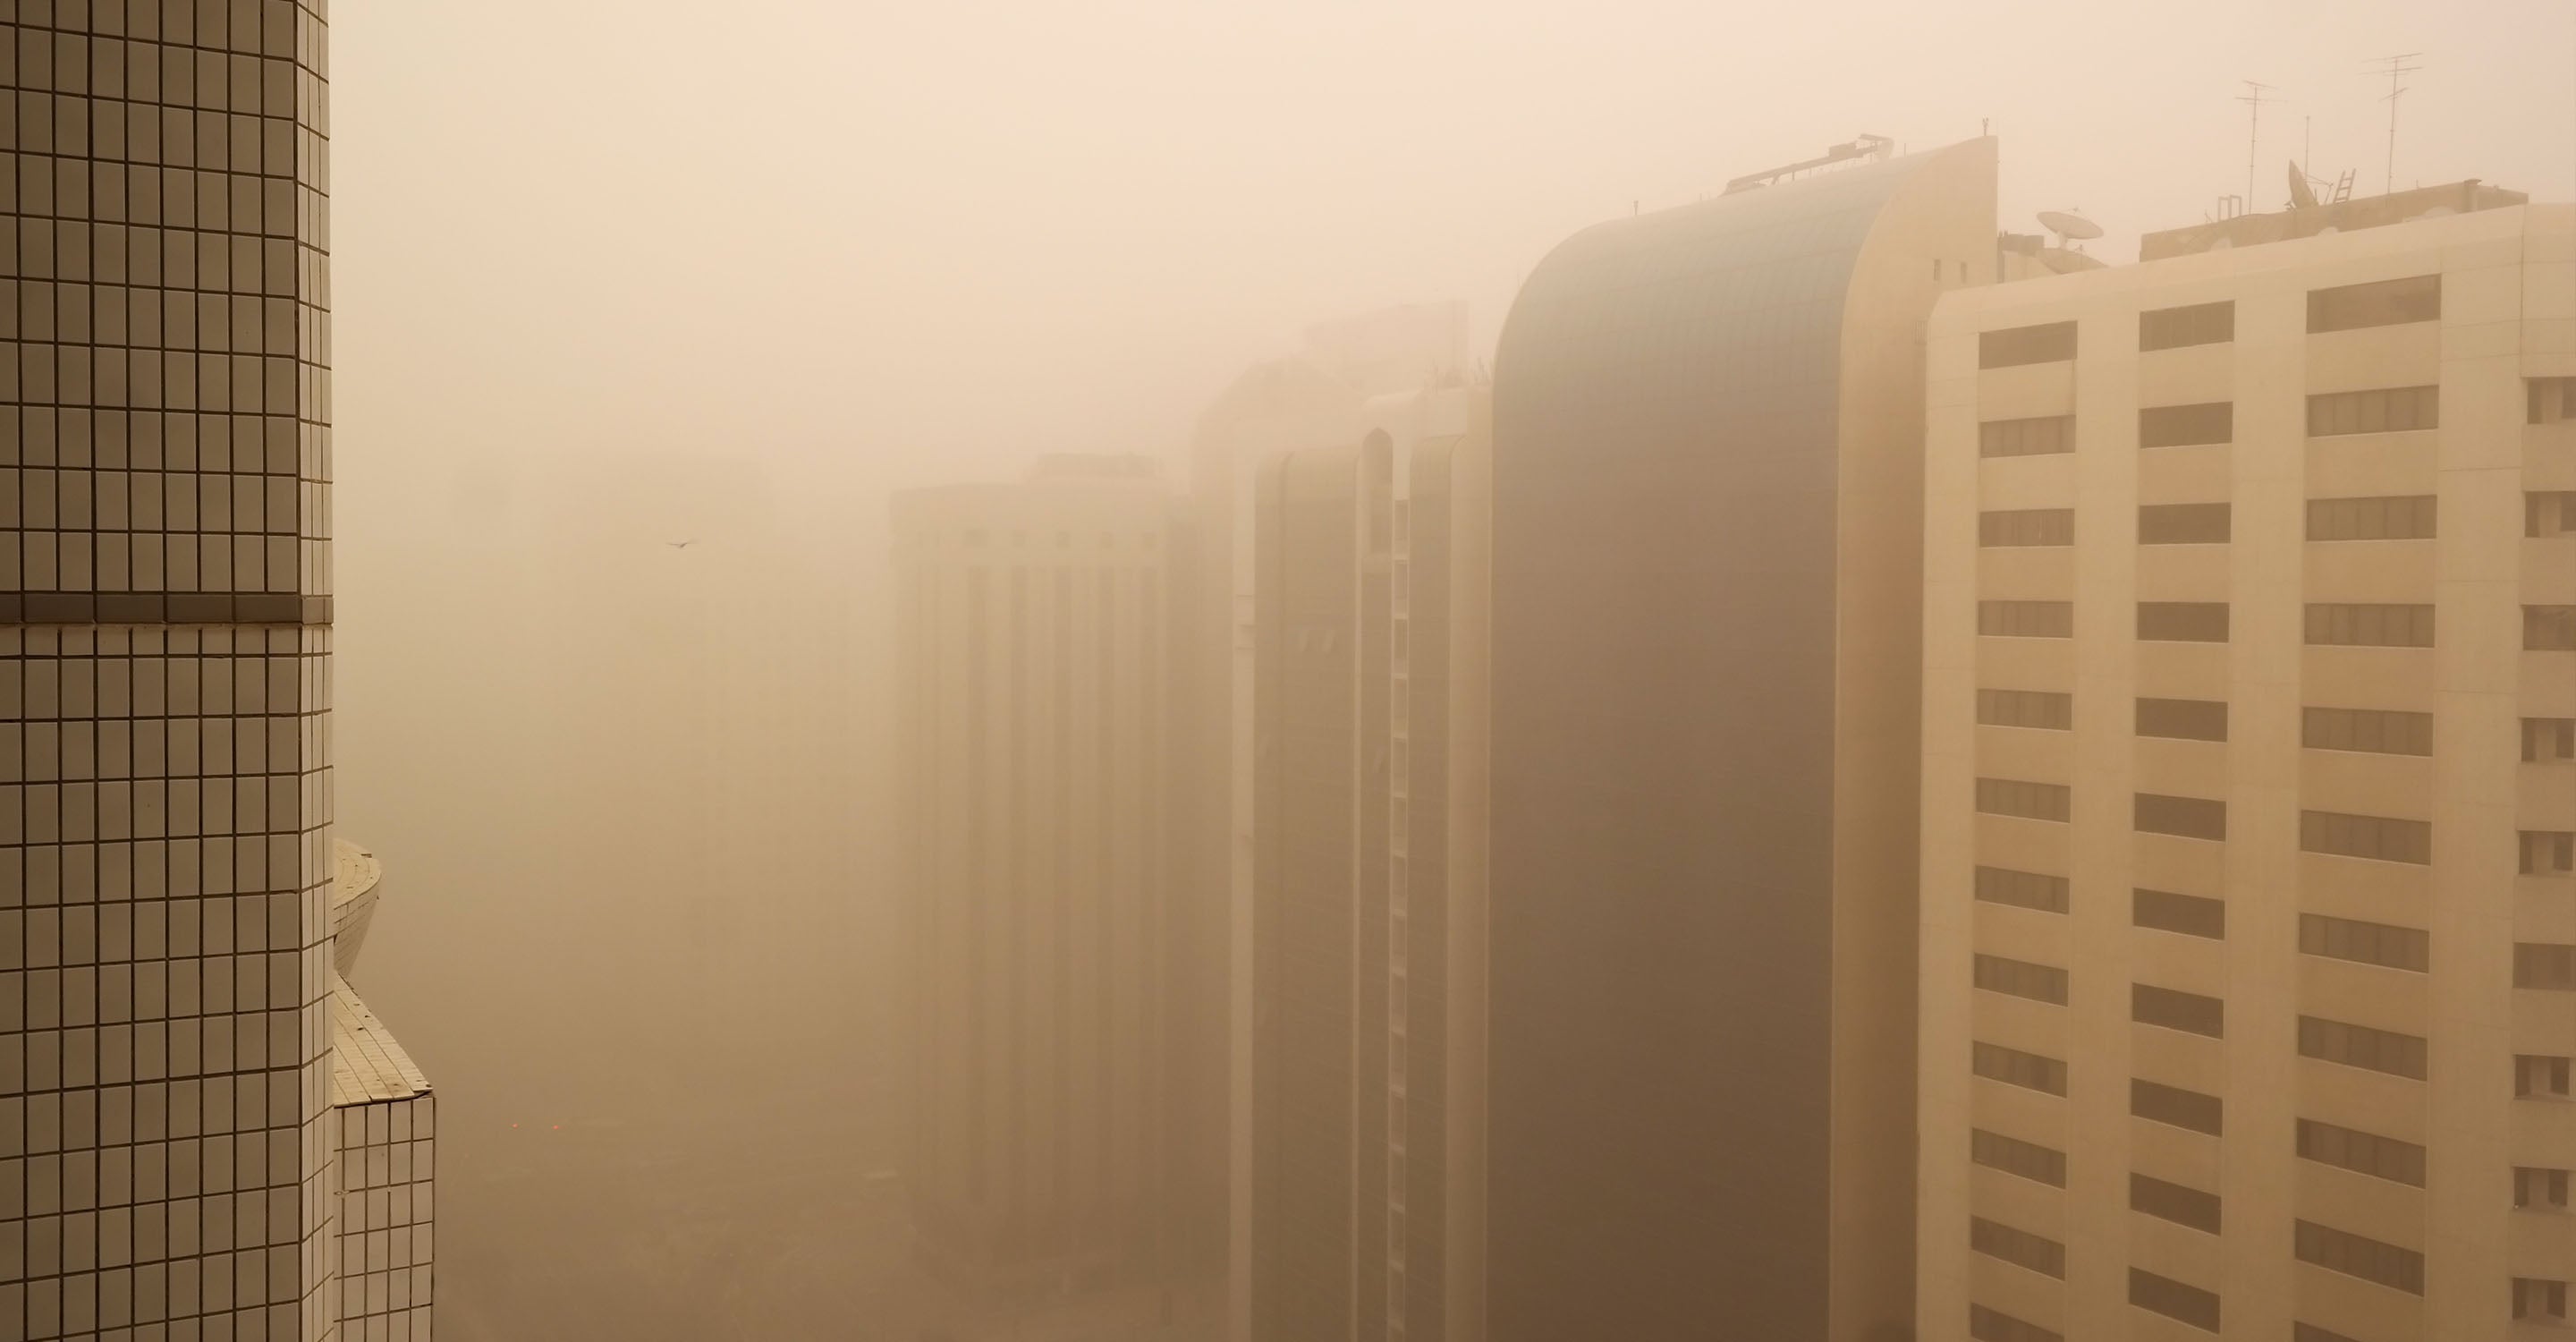
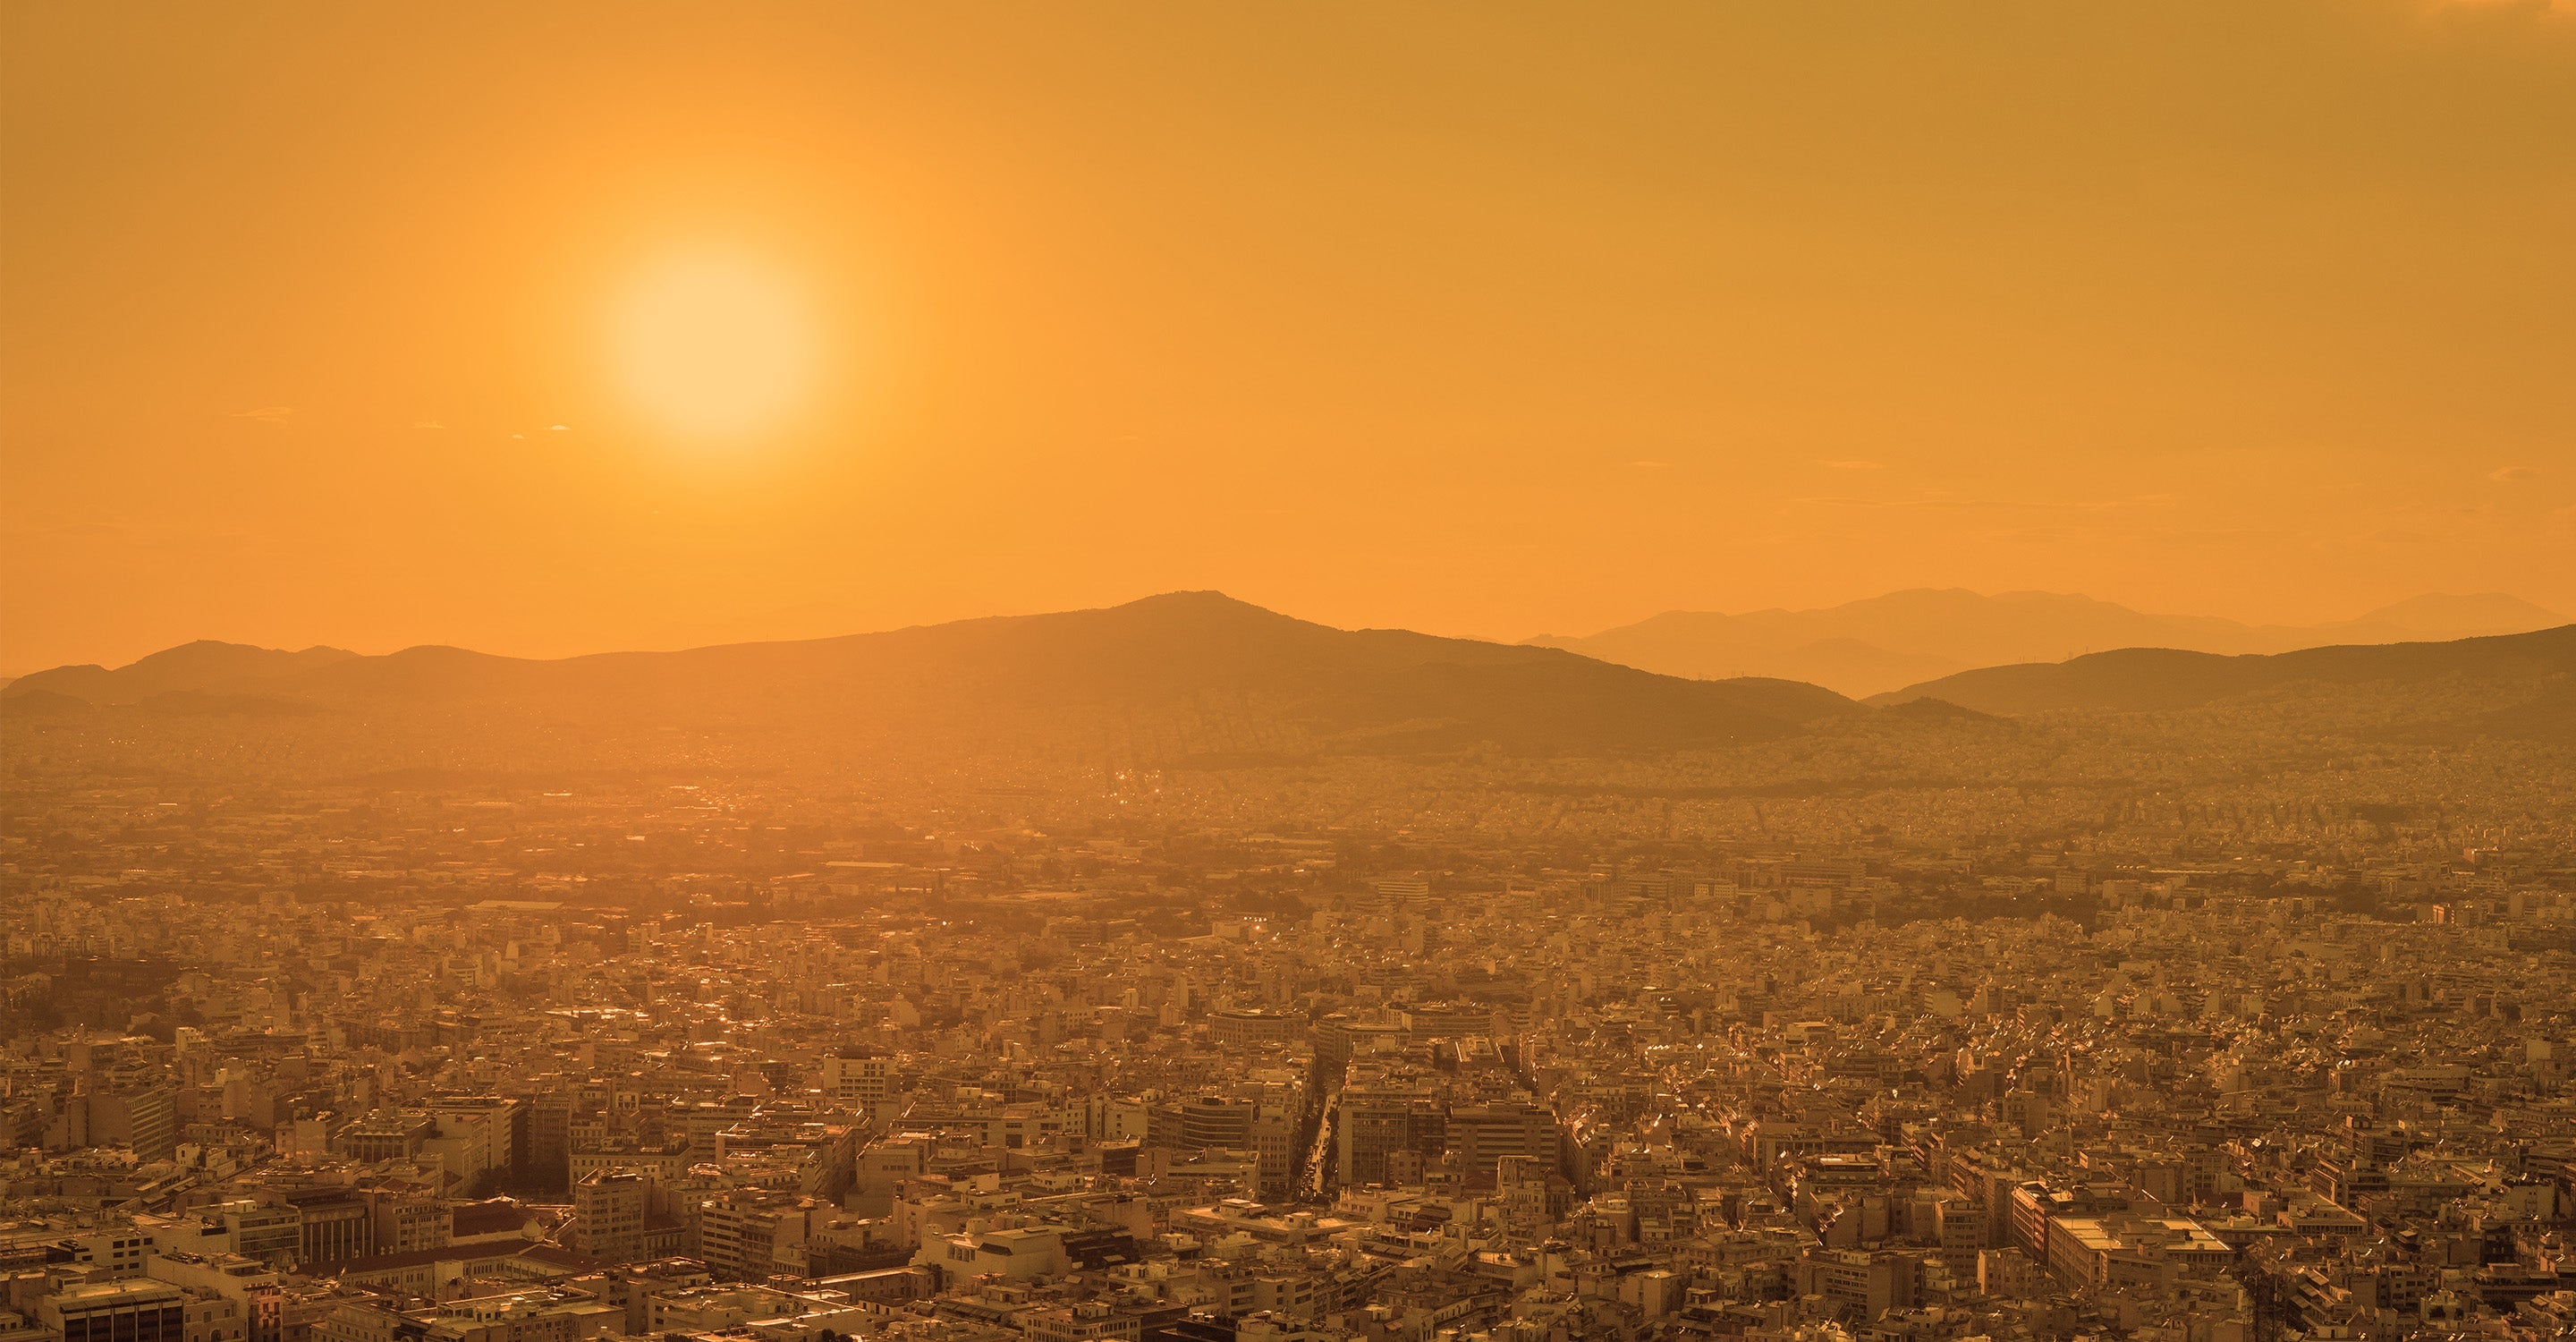
Air pollution is often described as “smog,” a combination of pollutants in the air including ground-level ozone and PM2.5. Ontario smog season spans the months of May through September, where PM2.5 and ozone levels are typically at their highest concentrations. The region’s summer smog owes to weather patterns, such as high-pressure cells that draw pollutants from industrial and urbanized US cities over the US-Canada border, elevating air pollution levels in Ontario’s lower Great Lakes region.
Ozone pollution is unique in that it is not emitted directly from ground sources but rather formed in the atmosphere when nitrogen dioxide (NO2) and volatile organic compounds (VOCs) react in the presence of sunlight. It is for this reason that ozone concentrations are highly dependent on weather and climate conditions, which vary year to year. 2016 represented a warmer than average year with prolonged conditions for smog formation. During the summer of 2016, Ontario experienced 25 days of temperatures greater than 30°C that encouraged ozone development, while 19 air monitoring sites across the province recorded ozone levels above threshold.
Ontario’s action to reduce the emissions of ozone precursor pollutants has led to a 30 percent decrease of NO2 from 2007 to 2016. Despite this reduction, measured ozone has increased by 1 percent during this same time frame. Ontario ozone exceedances are most frequently reported in the southwestern part of the province on the shore of Lake Huron and Lake Erie, near the US border where transboundary pollution has a more significant effect on measured air quality. Scientists attribute rising ozone levels here to warming temperatures as a result of climate change, combined with ambient precursor pollutants carried over from industrial US cities nearby.
Fine particulate matter, or PM2.5, is another critical component of smog. More often than ozone, PM2.5 exists at levels that exceed Canada’s “good” standards. Ontario PM2.5 pollution comes primarily from residential wood-burning in the winter, wildfires in the late summer and early fall, and industry and transportation emissions.
The World Health Organization recommends that annual PM2.5 concentrations not exceed an average of 10 μg/m3. In Ontario, 97 percent of cities met this standard in 2019 – only Hamilton exceeded it. By the more stringent Canadian standard for annual PM2.5 set at 8 μg/m3, however, 3 monitored cities failed attainment: Hamilton air quality (10.1 μg/m3), Bainsville air quality (8.2 μg/m3), and Windsor air quality (8.2 μg/m3).
While these three cities are the most polluted in Ontario, they also ranked highly in the country, landing as the 11th, 21st, and 38th most polluted cities nationwide, respectively.
Between 2007 and 2016, PM2.5 concentrations in Ontario have fallen by 12 percent. The reductions are attributable to more stringent industrial and vehicular regulations and the phase-out of coal-fired power plants. Despite these air quality improvements, however, wildfires are expected to become more frequent and severe and may threaten Ontario’s PM2.5 concentrations in the future as the leading natural source.2
Ontario is Canada's most populous province, home to nearly 40 percent of the nation’s population. It is also very large in area – at 1.076 million km², it is the second-largest province after Quebec (more than 1.5 times the size of Texas in the United States). Given the province’s large size and numerous metropolitan hubs, air quality in Ontario varies widely.
Ontario’s largest and most polluted cities are located largely in the southernmost part of the province close to the United States border. Many US border cities have air quality that exceeds Canada’s standard for annual PM2.5 exposure at 8 μg/m3. These cities include Cleveland air quality (13.3 μg/m3), Chicago air quality (12.8 μg/m3), Detroit air quality (9.9 μg/m3), Minneapolis air quality (8.8 μg/m3), and Milwaukee air quality (8.5 μg/m3).
Of Ontario’s largest cities, only Hamilton exceeds the Canadian PM2.5 standard (with an average annual concentration of 10.1 μg/m3). Ordered by descending population size, other major Canadian cities that meet standard include Toronto (7.4 μg/m3), Ottowa-Gatineau (7.8 μg/m3), Kitchener (6.8 μg/m3), London (6.4 μg/m3), and Oshawa (6.2 μg/m3).
Ontario’s best air quality tends to be further removed from the border and other major cities. In 2019, the top 5 cleanest cities in Ontario included Chalk River, Parry Sound, Lake of Bays, North Bay, and Sault Ste. Marie — all of which averaged annual PM2.5 concentrations under 5 μg/m3.
Ontario has taken an aggressive approach to combating air pollution, which has resulted in cleaner air today than at any time in recent history.
From 2007 to 2016, air pollution concentrations of key criteria pollutants have declined significantly, including:
These results come after a number of air quality regulations in Ontario, including:
Fine particulate matter (PM2.5) and ozone represent the two most dangerous air pollutants in Ontario present at harmful levels. While both pollutants contribute to short- and long-term health effects ranging from difficulty breathing and irritation of the airways to lung damage and early death, they differ by source and effect.
PM2.5 describes a mixture of microscopic airborne particulates, ranging from dust, ash, and pollen to fumes, chemicals, and aerosols. It is defined by its size rather than its chemical makeup, as different health effects are correlated to particles of different sizes. PM2.5 pollution is the smallest type of particulate matter commonly measured by Canada’s Environmental Protection Agency (EPA). It is often weighted in importance and danger for its ability to bypass the lungs and become absorbed into the circulatory system, causing far-reaching health effects.
As for anthropogenic, or human-caused, sources, Ontario’s provincial government estimates that:
From 2007 to 2016, Ontario PM2.5 emissions have been reduced by 16 percent. The largest reductions have been in transport emissions, followed by industrial emissions.
Ground-level ozone is a highly irritating ,colorless, odorless gas pollutant formed when nitrogen dioxide (NO2) and volatile organic compounds (VOCs) react in sunlight. Ozone formation is highly dependent on certain ideal environmental conditions, including temperatures over 29 degrees and the prevalence of precursor pollutants. Since abundant sunshine and warm temperatures are required for ozone formation, changing weather causes differences in ozone concentrations. Ontario’s highest ozone levels typically occur on warm days between May and September, often occurring from noon through the early evening.
Human-contributed sources for nitrogen oxides in Ontario include
Human-contributed sources for volatile organic compounds in Ontario include
In 2005, Ontario began to phase out coal-fired power plants in an effort to drive down emissions and adverse health effects related to dirty air. A preliminary report estimated this action would lead to $3 billion in annual health care savings as a result of fewer smog-related air toxins.4 Subsequent reports and post phase-out data, reveals changes in Ontario air quality were rather small, and the previous model overestimated its effect on health care savings.
A study conducted by Fraser Institute found that the elimination of coal-fired power plants reduced PM2.5 levels in Ontario’s urban areas by 1 to 2 μg/m3, equivalent to a 6 to 12 percent reduction from the city's highest levels. Less significant were Ontario’s reduction in ozone levels, which appear to have been offset by an increase in natural gas plant emissions.
While the coal phase out reduced Ontario air pollution levels, perhaps more significant was the reduction of greenhouse gases in the fight against climate change rather than the reduction of air pollutants in relation to adverse health effects. Moreover, while costly, the move to renewable energies is a positive step towards improving both public health and the environment in the long-term.
+ Article Resources
[1] Ministry of the Environment, Conservation and Parks. (2016). Air quality in Ontario 2016 report. Ontario Government.
[2] Rapp LJ. (2016, May 10). Climate change means more forest fires in Ontario. Here’s why. TVO.
[3] Peters D. (2020, October 5). Do Ontarians dream of electric vehicles? TVO.
[4] McKitrick R, et al. (2017). Did the coal phase-out reduce Ontario air pollution? Fraser Institute.
96Contributors
4 Government Contributors
9 stations
1 station
5 Non-profit organization Contributors
1 station
1 station

1 station

1 station

2 stations
25 Individual Contributors
1 station

1 station
1 station
1 station
1 station

1 station

1 station

1 station

1 station
1 station

1 station
1 station

1 station
1 station

1 station

3 stations
1 station
1 station
1 station
1 station
1 station
1 station
1 station

1 station
1 station
62 Anonymous Contributors

62 stations