Da Nang air quality map
Live air pollution map of Da Nang
202.8K people follow this city
Full screen
Contributors
1
Stations
1
Contributors category
0
Government
0
Non-profit organization
0
Educational
0
Corporate
0
Individual
1
Anonymous
Most polluted air quality stations
| # | station | US AQI |
|---|---|---|
| 1 | ThangYen - Nhon Hoa | 96 |
community highlight
Da Nang most followed contributors
Health Recommendations
| Sensitive groups should reduce outdoor exercise | |
| Close your windows to avoid dirty outdoor air GET A MONITOR | |
| Sensitive groups should wear a mask outdoors GET A MASK | |
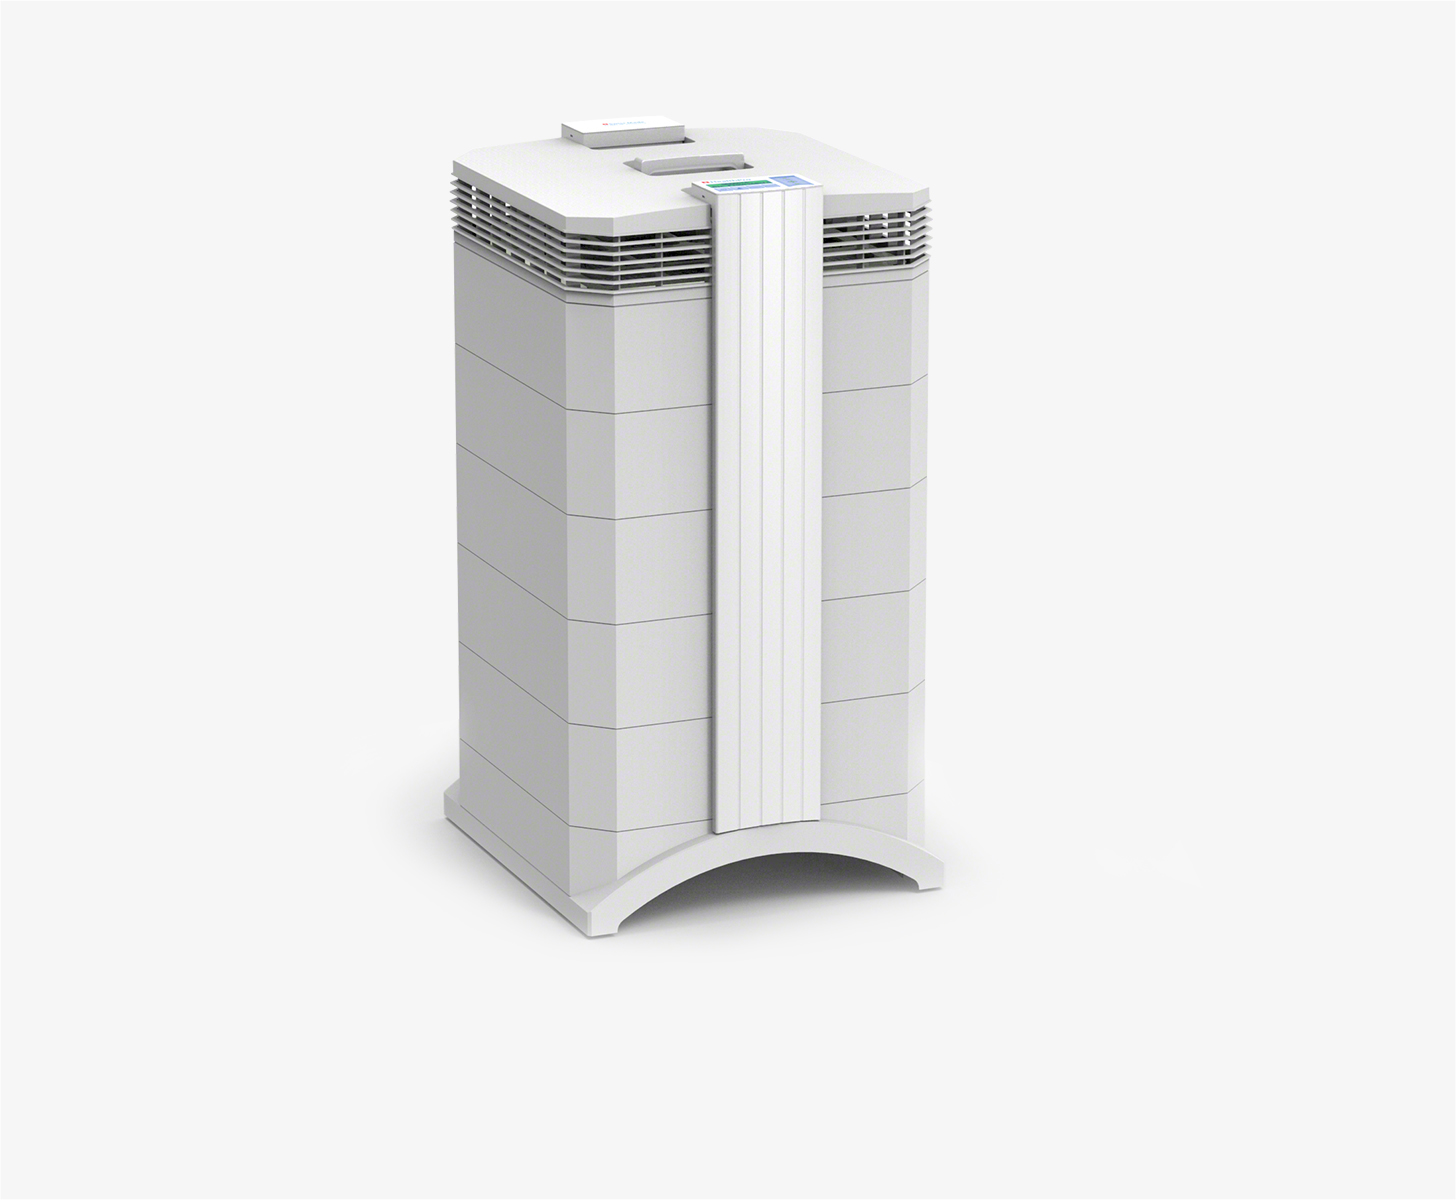
| Sensitive groups should run an air purifier GET AN AIR PURIFIER |
Become a contributor
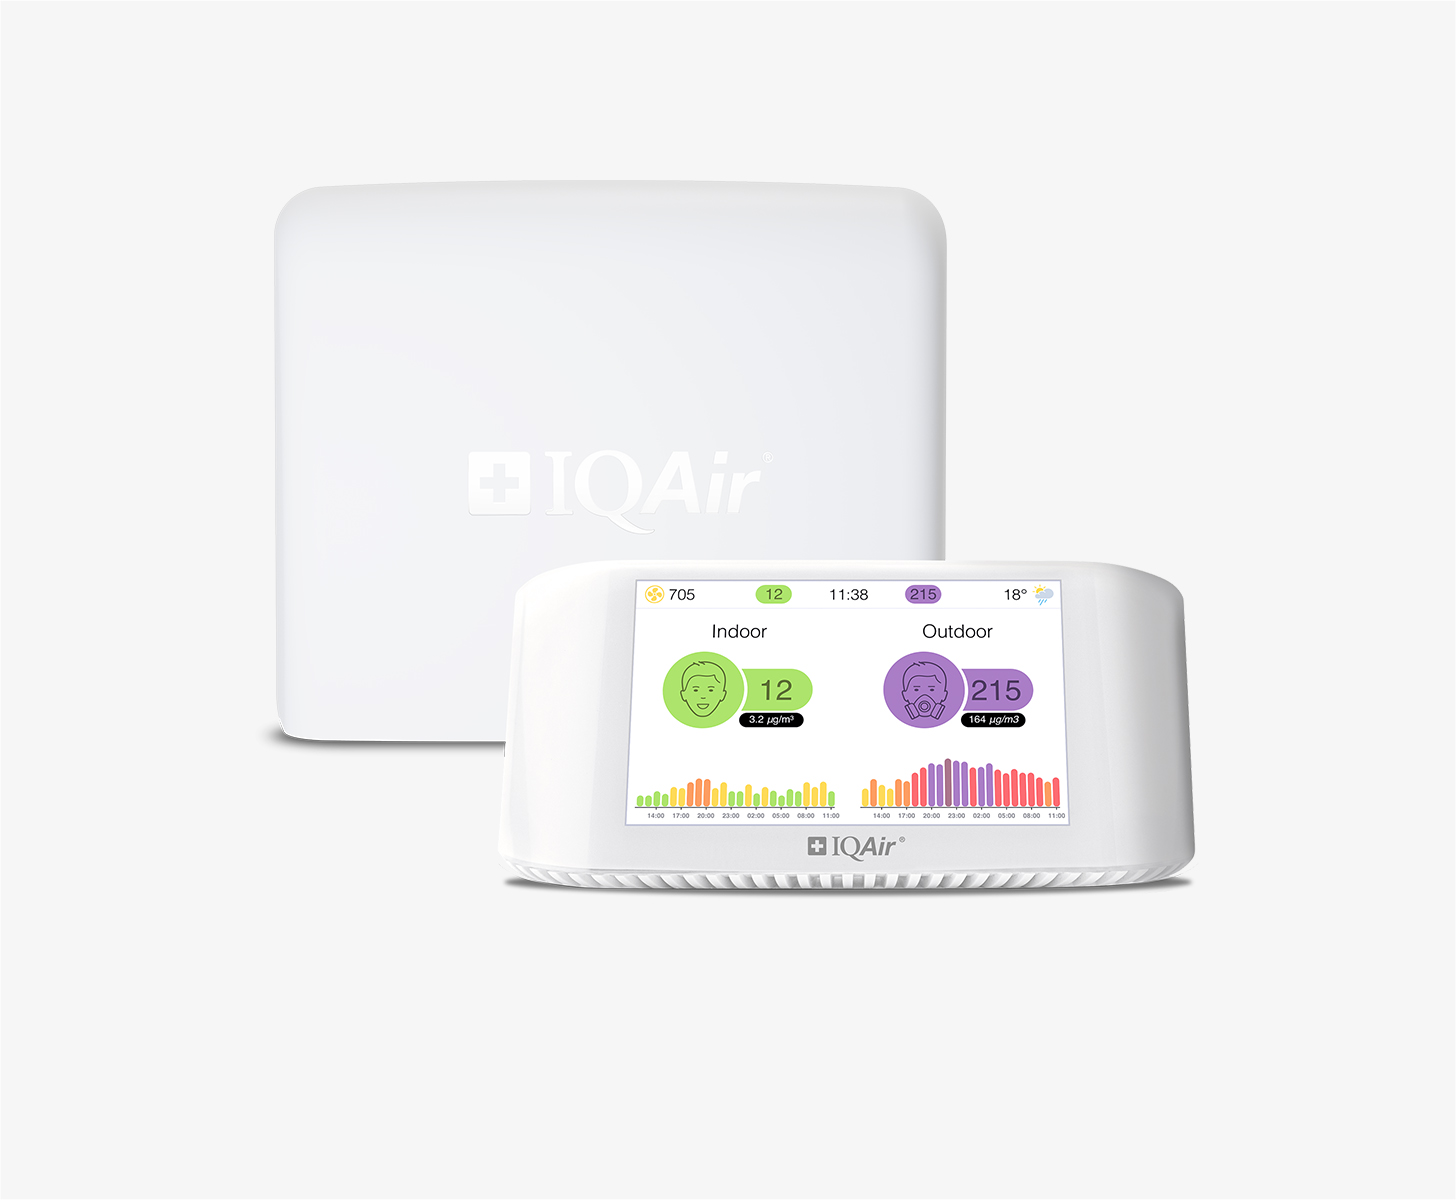
Get an AirVisual Outdoor and contribute to collecting millions of data points for the Da Nang map to track local air pollution
Understand air pollution and protect yourself
Da Nang MAP AIR QUALITY ANALYSIS AND STATISTICS
What does the air quality map for Da Nang tell us about air pollution?
The air quality map for Da Nang is interactive and makes use of different coloured discs to indicate the air quality. The colours range from pale green which indicates good quality air to dark maroon which is used to show hazardous air quality. The darker the colour, the worse the air. Even the overall background colour is shaded to indicate air quality. In very polluted cities, the map takes on a reddish hue which indicates poor air quality.
If a circle is selected, a drop-down box appears which gives the user more detailed information as to the state of the air at the chosen monitoring station. It shows the level of the PM2.5 pollutant as well as the US AQI number. This is used as a set of metrics endorsed by the World Health Organisation (WHO) and is used in comparison for the air quality in cities throughout the world by using comparable standards. It is calculated by measuring the levels of six of the most commonly found pollutants such as nitrogen dioxide, sulphur dioxide, ozone, carbon monoxide and PM2.5 and PM10. If all six figures are not available, a level is calculated by using what data there is.
What information can be collected from the air pollution map for Da Nang?
When the air pollution map for Da Nang is first opened many of the coloured discs may be superimposed on each other, but as the map is expanded, the discs can reveal other discs which previously may have been obscured. Each disc represents a monitoring station so it really depends on how many stations are within the city as to how many circles will be seen on the map. Some information is obtained using satellite imagery.
The darker colours are often towards the suburbs and belong to the industrialised zones which have been created to keep the city centre air clean. This is not always the case though as there are inevitably some units close to the city that have been there for many years. Some of these older units are encouraged to move to the industrial zones outside the city centre, often by means of subsidies. This also means that their staff vehicles are no longer using the city centre roads.
Does the air pollution map for Da Nang show the user where the worst air quality is?
The air pollution map for Da Nang does not directly identify the source of the pollution, it merely shows the results taken from the monitoring stations throughout the city and its environs. The numbers seen in the coloured discs are an indication of where the poor-quality air is; the higher the number the worse the air quality is, and the colour will be darker for poorer air quality.
A coastal city such as Da Nang should not have such high levels of pollution due to its location. It is like this because of the illegal burning of waste products, a poor planning system for its transportation and industrial units in residential areas. The future objective is to provide a sustainable city model with affordable public transport and low-cost energy from renewable sources. The key factor in achieving this goal is to reduce the amount of petroleum products currently being used. The popular charcoal briquettes used by many people for cooking contribute greatly to the poor-quality air but to replace these would be difficult as they are readily available, very convenient and very cheap to use!
What is the real situation on the air pollution map in Da Nang?
It can be said that Da Nang is one of the places where the level of air pollution is controlled. The city has maintained the clean air index by ensuring the availability and quality of air quality data, reducing emissions from mobile sources, reducing emissions from stationary sources, improving efficiency and improving efficiency. energy efficiency and cleaner fuel use. Air quality is much improved partly due to the data collected from the stations around the city.
The city actively invests in bus routes with very good ride quality, and deploys subsidies for passengers to attract and encourage more people to use. Electric vehicles and hybrid vehicles certainly help keep the air in the city centre clean.
In Vietnam, air pollution is not only a hot issue concentrated in developed cities, industrial zones and clusters, but has become a concern of the whole society. This is considered one of the leading agents that pose a serious risk to public health.
Is any other information available on the air quality map for Da Nang?
The air quality map for Da Nang has to be studied in conjunction with the information given on the main city page.
Industry is the largest source of man-made pollution. Pollution is the process of burning fossil fuels such as coal, oil, and gas which produce harmful gases. Industrial sources have high toxic concentrations, are concentrated in a small space, and depending on the scale of production and the fuel used, the amount and type of hazardous substance will vary.
Traffic is also a cause of air pollution, especially in urban areas and densely populated areas. The combustion of engine fuel creates harmful gases that affect the air.
The local government are actively raising public awareness of environmental protection. They provide training for 45 agencies and units on energy saving use, propaganda for 1,000 households and small businesses on energy saving solutions. They will plant more trees, protect forests and develop eco-tourism with the aim of preserving the environment and improving the breathability of the city.
What is the PM2.5 measurement often used on the air pollution map of Da Nang?
Dust particles with diameter less than or equal to 2.5 µm (microns). This type of dust is formed from substances such as carbon, sulphur, nitrogen and other metal compounds, suspended in the air. As the concentration of PM2.5 dust in the outdoor air increases, the air will appear hazy and visibility is reduced. Due to the fine dust PM2.5 with the size of 1/30th of a hair, it is considered the most dangerous "killer" in the air because of its ability to penetrate deep into the body, causing a series of respiratory diseases.
Da Nang air quality data attribution
1Contributor
 1 Anonymous contributor
1 station
Anonymous Contributor
1 Data source
