

Chiang Mai air quality map
Live air pollution map of Chiang Mai
11.7M people follow this city
Full screen


Contributors
70
Stations
78
Contributors category
3
Government
2
Non-profit organization
22
Educational
10
Corporate
27
Individual
6
Anonymous
Most polluted air quality stations
| # | station | US AQI |
|---|---|---|
| 1 | CHan coffee | 209 |
| 2 | Grand Canyon Chiang Mai | 177 |
| 3 | Hussadhisawee Soi 3 | 171 |
| 4 | North Chiangmai University | 171 |
| 5 | Chiang Mai. Baan Sirin Home | 169 |
| 6 | CENDiM CMU | 168 |
| 7 | Bright Seeds International Kindergarten 2 | 166 |
| 8 | Kankanok19 village | 166 |
| 9 | Khuang Sri Boon | 166 |
| 10 | City Hall, Chiangmai | 165 |
Health Recommendations
 | Avoid outdoor exercise |
 | Close your windows to avoid dirty outdoor air GET A MONITOR |
 | Wear a mask outdoors GET A MASK |
 | Run an air purifier GET AN AIR PURIFIER |
community highlight
Chiang Mai most followed contributors

Become a contributor
Get an AirVisual Outdoor and contribute to collecting millions of data points for the Chiang Mai map to track local air pollution
News
The latest air quality news and resources.


Understand air pollution and protect yourself
Chiang Mai MAP AIR QUALITY ANALYSIS AND STATISTICS
What information is shown on air quality maps in Chiang Mai?
Air quality maps in Chiang Mai show pollution in the form of a US AQI reading. These figures will vary throughout the year, and may even fluctuate significantly throughout a single day. Air quality maps can be extremely useful in knowing exactly where the most polluted spots in Chiang Mai are, so that appropriate measures can be taken to avoid them.
Can referring to the air quality maps help to reduce health problems in Chiang Mai?
As the air quality maps in Chiang Mai show which areas of the city have the highest levels of pollution present, users can take steps to avoid these areas over the course of the year. With this in mind, some of the health issues that can be avoided by using air quality maps and air pollution maps (for informative purposes) are ones such as chronic obstructive pulmonary disease (COPD), with COPD being an umbrella term that encompasses asthma, bronchitis, emphysema and pneumonia. Other illnesses that may be avoided by referring to the air quality maps in Chiang Mai include those that affect the cardiac system (among others), with skin conditions also potentially flaring up along with irritation to the mucous membranes such as the eyes and nose.
Do the air quality maps show higher readings at certain times of the year in Chiang Mai?
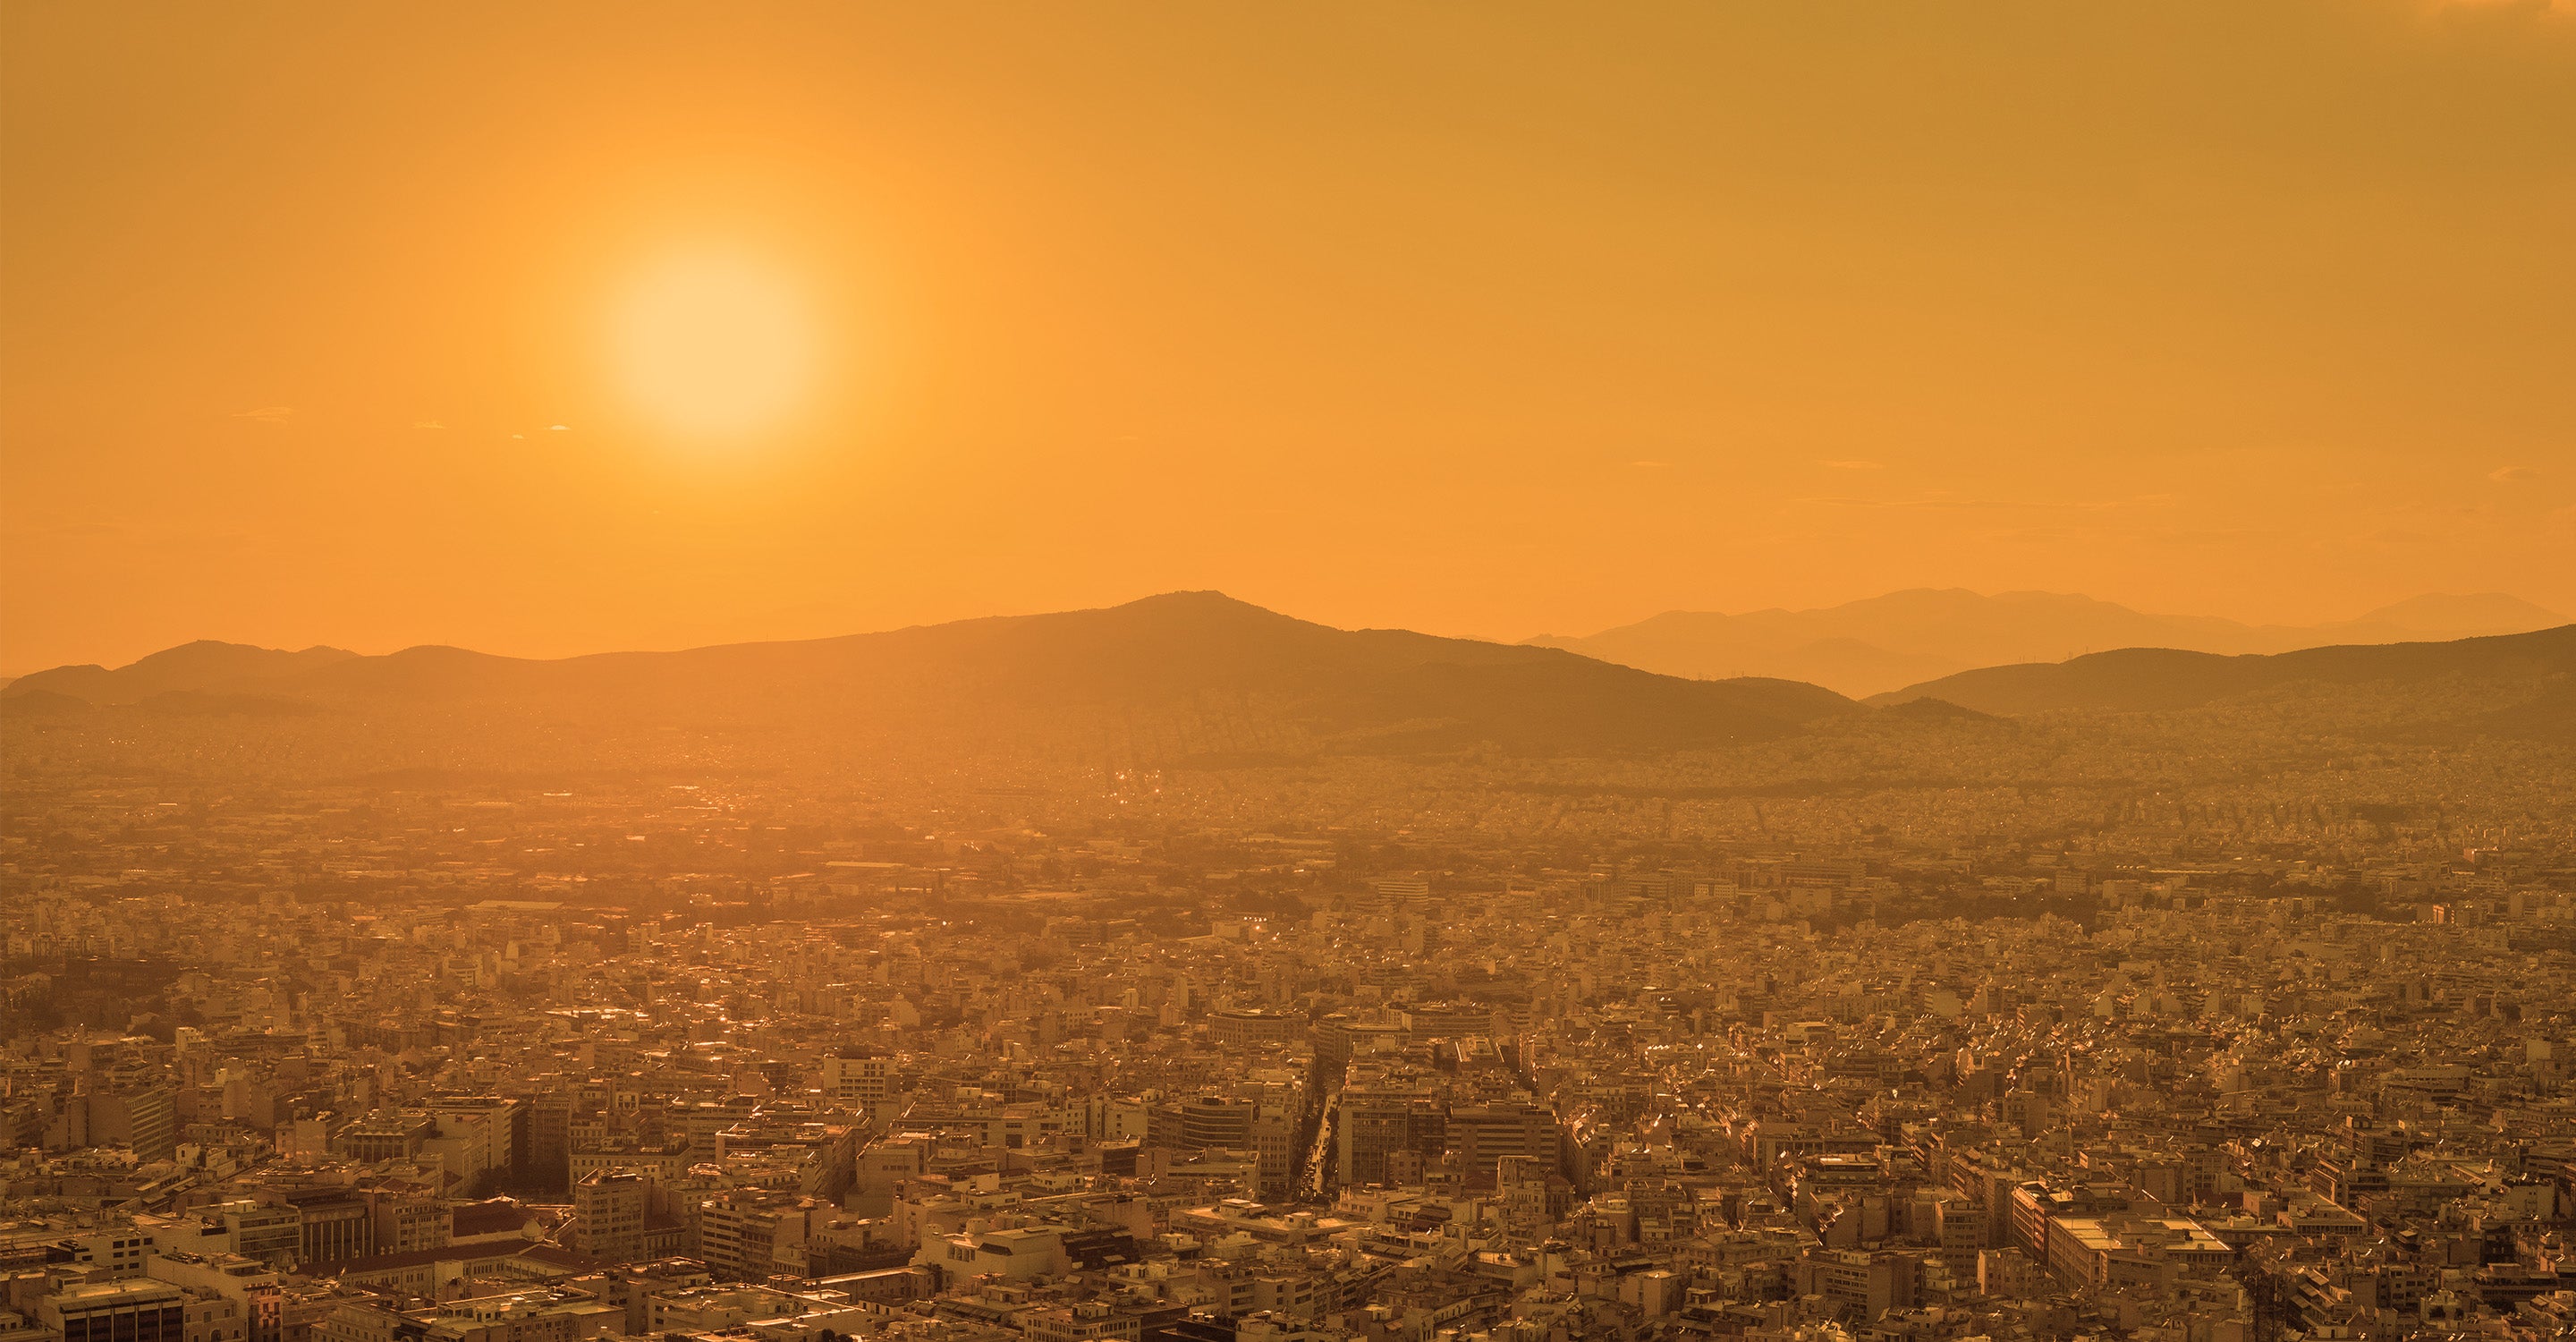
Due to Chiang Mai being in the northern regions of Thailand, it has a problem regarding the mass burning of raw and organic materials, in particular dead crops and plants being burnt on farmland, as well as larger swathes of forestland being set ablaze. The air quality maps for Chiang Mai will thus show considerably higher readings in the months that coincide with these burning practices or slash and burn farming as it is commonly known. Areas on the air quality maps that are closer to affected sites will show considerably higher pollution readings towards the end of the year (typically starting around August or September, although it can vary) and carrying on until the earlier months of the following year. As such, the air quality maps for Chiang Mai will most likely have their highest readings start to appear at years end, with some of the most prominent spikes appearing on the pollution maps in the first few months of the following year, with January through to March having some sizeable readings. Utilizing air quality maps can help individuals to figure out which areas have the least amount of pollution and thus give people access to the cleanest possible routes in the city.
What are some of the types of pollution you can see on air quality maps in Chiang Mai?
As mentioned above on numerous occasions throughout the various questions related to air quality maps and air pollution maps in Chiang Mai, US AQI is used as the main form of pollution calculation for the city, as well as on all air quality maps in use throughout Thailand as well as the rest of the world. As far as it goes for viewing the types of pollutants that are found in the air in Chiang Mai, the air quality maps are limited to showing the US AQI figure only, as opposed to the city pages (which are linked directly to this page and vice versa), which show individual concentrations of the main pollutants that go up into making up the US AQI aggregation, formed as it is from several chemical compound pollutants, as well as grouped pollutant types, which are the PM10 and PM2.5 forms of air pollution. These particles can be comprised of many different and dangerous materials, as long as they fall into the criteria of being ten or less micrometers in diameter for PM10, and 2.5 micrometers or less for PM2.5.
Whilst the air quality maps for Chiang Mai do not show the exact concentrations for these pollutants, one can get a better idea when referring to the air pollution maps on what pollutants they may be exposed to, simply by getting more insight into what the US AQI figure is exactly formed from. These main pollutants are ozone or smog as it is more commonly referred to when it accumulates on ground level (often in visible clouds that can be seen around busy roads and other similar sites during times of intense sunshine when UV rays are at their highest). Others include nitrogen dioxide and sulfur dioxide as well as carbon monoxide. For the city pages on Chiang Mai, one may find more information for the concentrations on each day, but regarding the air quality map pages, information can also be gleaned by seeing how high the US AQI readings are, at any particular day and time on the air quality map. If there is a higher US AQI reading present across the many sites that show up on the air pollution maps, then there is thus likely to be a higher level of each of these pollutants in the air. Of note is that areas that show a high level of pollution on the air quality map, and also coincide with being near to or directly beside a busy road, then it is very likely that pollutants such as nitrogen dioxide will be more present, due to its extensive release from all manner of vehicles. High US AQI readings on the air quality maps will also indicate that particle-based pollution can be higher, and in regards to PM2.5 levels, these represent the most dangerous forms of pollution, with their extremely small size causing a myriad of health issues for those that are exposed regularly, or even excessively over smaller periods.
PM2.5 materials that may be present in the air when the readings on the air pollution maps in Chiang Mai are high include ones such as ultrafine dust, silica particles, metals, nitrates and sulfates, mold spores and bacteria, as well as water or oil vapors. Areas on the air quality maps that are near dusty or poorly maintained roads, as well as close to construction sites, are very likely to have higher levels of these ultrafine particles present in the US AQI readings (with particle-based pollution being used to calculate the US AQI figure along with the above-mentioned chemical pollutants). Larger or more coarse particles that fall under the PM10 bracket may also be found in the air, and include sand or gravel. They cause far less dire health consequences when compared with the potential of PM2.5 to cause harm, however, they may irritate the skin and mucous membranes as well as coughs or mild chest infections when excessive amounts are inhaled. All of these can be inferred when using the air quality maps and air pollution maps for Chiang Mai, and as such their use can not only help individuals to avoid more heavily polluted areas throughout the city and surrounding areas but also get a clearer idea of what pollutants they may be encountering. Using the air quality map page along with the city page can give an even clearer indication of the overall level of air cleanliness or lack thereof.
Chiang Mai air quality data attribution
70Contributors
 Chiang Mai Municipality
1 station
 Thailand Pollution Control Department
2 stations
 James Sc
1 station
3 Government Contributors
2 Non-profit organization Contributors


 American Pacific International School
1 station
- Ambassador Bilingual Academy - ABA
1 station
 Bright Seeds International Kindergarten
1 station
 British Concordance International School
1 station
 AiroTEC CMRU
7 stations
 Chiang Mai International School
1 station
- Lanna International School
1 station
 Meritton British International School
1 station
 Nakornpayap International School
1 station
 ฝ่ายอาคารสถานที ม.นอร์ท-เชียงใหม่
1 station
 Panyaden International School
1 station
- Prem International School
1 station
 Saidaroon Kindergarten School
1 station
 SISB Schools
1 station
 The Prince Royal’s College
1 station
 Unity Concord International School
1 station
 Varee Chiangmai International School
1 station
22 Educational Contributors


 Banana Coding
1 station
 CM Mediclinic
1 station
 Hotel
Hotel1 station
 La Casita - Mexican Food
1 station
 GunFoon ร้านกันฝุ่น
1 station
 Zynthier
1 station
- AirQ@cnx
1 station
 ร้านแซลทู คาเฟ่
1 station
 Sansiri
2 stations
 The Masterpiece
1 station
10 Corporate Contributors
- Pisanupong JP
1 station
 AiroTEC CMRU
1 station
- benjamas sittidech
1 station
 East Swasdiburi
1 station
- Peter Eisenbacher
1 station
 Udompong Yongdechasathit
1 station
 Cat Motors
1 station
 TarVong
1 station
 Rut Wong
1 station
- Per Schjetne
1 station
- samanahavemail
1 station
 Khuang Sri Boon
1 station
- Luang Nua
1 station
- S
1 station
 Chatkul
1 station
- Adisak F
1 station
- KaoChao
1 station
- Teera Klai
1 station
- จินตวัฒน์ ตุ้ยเต็มวงศ์
1 station
- HS
1 station
 PIRAB
PIRAB1 station
 Diddking
1 station
 Space Eatery
1 station
- pom
1 station
 Akecmtd
1 station
- matteo
1 station
27 Individual Contributors


 6 Anonymous contributors
6 stations
6 Anonymous Contributors
4 Data sources
 Data validated and calibrated by IQAir
Where is the cleanest air quality in Chiang Mai?
- CHan coffee 209
- Grand Canyon Chiang Mai 177
- Hussadhisawee Soi 3 171
- North Chiangmai University 171
- Chiang Mai. Baan Sirin Home 169
- CENDiM CMU 168
- Bright Seeds International Kindergarten 2 166
- Kankanok19 village 166
- Khuang Sri Boon 166
- City Hall, Chiangmai 165
- Serene Lake 165
- Wichai Wittaya English Program 165
- AiroTEC CMRU 163
- Baan Charoonsook 163
- Mea Hai Market - Kulapant village 5--7 163
- Nantawan Serene Lake Village 163
- Pruksa Ville 75 163
- San Phak Wan 163
- Hana Christian International Kindergarten 162
- Phra Sing 162
- natura green resort 162
- Ban Wangtan 161
- NIS-NAKORNPAYAP INTERNATIONAL SCHOOL 161
- Siwalee Cheong Doi 161
- Wang Tan 4 161
- CM Mediclinic 160
- Moo Ban 160
- STSC@CMU 160
- Americanmotors Chiangmai 159
- Prem International School 159
- Soi Sri Sukri 1 159
- APIS Main 158
- CM MUNICIPALITY - CMRU 21 158
- CM MUNICIPALITY - CMRU 23 158
- Nongphueng 444 M.1 158
- ODPC1_CMRU_AiroTEC 158
- Ruamchok Mall 158
- SALTU CAFE - แซลทู คาเฟ่ 158
- YuuBaan Studio 158
- Americana Chinese International School - ACIS 157
- CM MUNICIPALITY - CMRU 10 157
- Dumrongnivet Village 157
- La Casita - Mexican Food 157
- Si Phum, Mueang 157
- UCIS : Unity Concord International School 157
- CM MUNICIPALITY-CMRU-11 156
- Chiang Mai International School 156
- Pha Jee 156
- APISP 155
- Ambassador Bilingual Academy - ABA 155
- Banana Coding 155
- CM MUNICIPALITY - CMRU 24 155
- CM MUNICIPALITY-CMRU 7 155
- Panyaden International School 155
- British Concordance International School 154
- CM MUNICIPARITY CMRU 16 154
- Meritton British International School 154
- Varee Chiangmai International School 154
- 33 MD 152
- Hotel MAYU 152
- Khuang Pao Early Childhood Development Center 152
- CM MUNICIPALITY - CMRU 25 151
- Mr.Kleane Air Check 151
- Luang Nua 149
- The Prince Royals College 148
- SBS of Rangsit University (Chiang Mai) 145
- Sansiri - dcondo campus 145
- Singapore International School Chiangmai 2 145
- Sansiri - Burasiri Sanphisuea 140
- Lanna International School 138
- The First Church of Chiang Mai 129
- Chiang Mai Montessori International School 121
- Don Kaeo Village 7 119
- Cat Motors 109
- Space Eatery 102
- AQSEA_THA_002 93
- The Masterpiece SceneryHill 82
- Saidaroon Kindergarten 70


