


خريطة جودة الهواء في Oakland
خريطة تلوث الهواء الحية لـ Oakland • 197.1K Followers • 06:00, أكتوبر 21 التوقيت المحلي







محطات
مرافق الهواء النظيف
أهم المساهمين في Oakland
من يشارك بيانات جودة الهواء الخارجي في Oakland؟
المحطة المميزة
اكتشف بعض أفضل محطات التركيب في Oakland

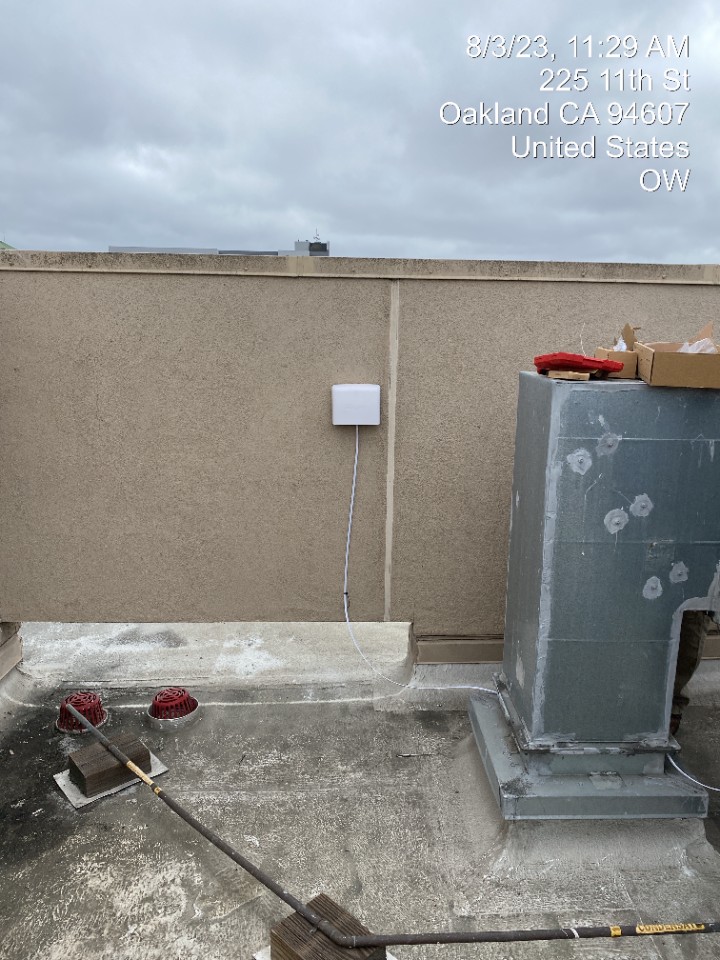
معرض المحطة

Lincoln Elementary School, Oakland
53
أحدث المحطات تم نشرها في Oakland
ترتيب محطات AQI⁺
أحدث المحطات

مرافق الهواء النظيف



تعرف على المزيد حول جودة الهواء العالمية


تعرّف على المزيد حول تلوث الهواء في Oakland
How bad is Oakland air quality?
Oakland air quality consistently ranks among the worst in the United States. In 2019, the city faced challenges in meeting US Environmental Protection Agency (EPA) attainment levels for both PM2.5 and ozone pollution, the nation’s most pervasive air pollutants at dangerous levels.
The American Lung Association’s (ALA) annual “State of the Air” report grades cities on their ability to meet federal air pollution targets and ranks them comparatively. For measures of unhealthy ozone days and 24-hour PM2.5 pollution, Oakland’s report card received “F”s.1
Ozone is a key component to smog, created when precursor pollutants like nitrogen oxides (NOx) and organic substances, including volatile organic compounds (VOCs), react in sunlight. Since temperatures over 80°F are typically required for its formation, Oakland ozone season tends to run from April to October. During these months, there are roughly 94 days over 80°F, increasing the threat of ozone.2
In the 2016 to 2018 monitoring period, Oakland air quality experienced a weighted average of 8.8 unhealthy ozone days, more than double the allowable federal target of 3.2 unhealthy days. This weighted average is calculated from the city’s 20 “orange” ozone days, 3 “red” ozone days, and 1 “purple” ozone day. Since at least 1996, Oakland has never met federal ozone targets.
Compared to other cities nationally, these figures ranked Oakland 8th for worst ozone out of 228 included metropolitan areas.
Inhaling even small levels of ozone can produce breathing problems, such as coughing, irritation, and chest pain as well as long-term health problems, such as lung cancer, permanent lung damage, and early death.
Oakland tends to have a better grasp on city-wide PM2.5 levels. From 2003 to 2014, Oakland succeeded in meeting both targets for annual and 24-hour PM2.5. More recently, however, PM2.5 levels have been slipping. Part of Oakland's challenge is unpredictable wildfires, which have become increasingly frequent and severe. Oakland’s highest PM2.5 levels tend to be a result of smoke from nearby wildfires.
While the 2019 annual average for PM2.5 met the US EPA target, it failed to meet the 24-hour PM2.5 target for an allowable number of unhealthy PM2.5 days. From 2016 to 2018, Oakland experienced a weighted average of 11.2 unhealthy PM2.5 days (far above the 3.2-day guideline).
In 2019, Oakland ranked 3rd nationally for worst 24-hour PM2.5 out of 217 included metropolitan areas, and 5th nationally for annual particle pollution out of 203 metropolitan areas.
PM2.5 is widely regarded as the most harmful air pollutant to human health. Exposure to PM2.5 has been definitively linked to health effects such as cardiovascular disease, respiratory illness, and premature mortality.
While annual averages and trends allude to typical air pollution levels in Oakland, real-time and forecast data should be monitored for actionable insights to present conditions. Oakland’s forecast air quality data is presented at the top of this page, beneath the city overview. Monitoring anticipated pollution levels and following health advisories can reduce pollution exposure by up to 80 percent.
What is the biggest source of air pollution in Oakland?
Mobile emissions from motor vehicles, ships, planes, and trains comprise the largest source of air pollution in Oakland.3 While transportation emissions are a constant threat to Oakland’s air quality, wildfires tend to give way to the city’s most extreme pollution events. Days or hours categorized as “unhealthy” or worse have historically registered from wildfire smoke in the Bay Area.
Oakland’s weather and geography can further exacerbate the city’s challenges with high emissions. Marine inversions cause Oakland’s polluted air to become trapped at the ground level. These marine inversions are caused when air cooled by the Pacific Ocean becomes capped by warmer, denser air above, flowing inland from the hills. As the upper warm air layer prevents the cooler air below from rising and dispersing normally, emissions accumulate, contributing to elevated air quality index levels in the Bay Area.
Use the Oakland air pollution map to discover the origin of pollution in real time. Watch as wind moves PM2.5 pollution from wildfires, roadways, and stationary emission sources to locations across the city.
Is Oakland air quality unhealthy?
Oakland air quality does often reach unhealthy levels. The city’s long history of difficulty in meeting federal air pollution attainment levels has taken its toll on residents.
Individuals sensitive to air pollution, such as children under 18, adults over 65, and those with pre-existing heart and lung conditions, tend to be more adversely affected than others. In Alameda County, there are 342,510 children under the age of 18, 230,510 adults over the age of 65, and 280,387 with qualifying underlying health conditions. All of these groups are subject to acute health complications as a result of Oakland’s high air pollution levels.
According to the California Department of Public Health (CDPH), asthma affects about 18 percent of Oakland’s youth, a figure roughly twice the national average. Nearly a third of these cases are estimated to be the result of poor air quality.
Differences in air quality across Oakland’s many neighborhoods, has resulted in differences in the health outcomes of residents. West Oakland, a lower income, under resourced community is one such example. Residents of West Oakland are 5 times more likely to be exposed to unhealthy air pollution than their higher-income city counterparts.
The health implications for West Oakland residents are similarly stark. Data indicates that residents here tend to live 7 years less than the Alameda County average. While a number of attributing factors may be at play, respiratory disease and related cancers are the leading cause of death in West Oakland, killing 176.8 per 100,000 people from 2015 to 2017.
The disproportionate burden this community carries, along with the East Oakland neighborhood, is an environmental justice issue which must be addressed. More stringent government regulations on high-emission sources, more equitable zoning, increased education on the dangers of poor air quality, and free resources for combating air pollution indoors and out are some such means to better address this inequality in the future.
Why is it so smoky in Oakland?
Wildfires in the Bay Area are becoming increasingly frequent and severe, giving way to smoky air quality conditions in Oakland. Some of the area’s worst fires have been relatively recent, with record acreage burned in 2017 and 2018. As of August, 2020 appears on track to exceed these years. Many environmental scientists attribute the growing problem of wildfires in America’s West to human-caused climate change.4 As conditions become hotter and drier, wildfires burn bigger, hotter, and faster.
Climate change has already doubled the risk of extreme fire conditions in California, according to a study published by the Lamont Doherty Earth Observatory at Columbia University. In the last 50 years, there's been an eight-fold increase in annual burned acreage, while at the same time summer temperatures have increased by 2.5 degrees.5
In August 2020, a series of wildfires near Oakland were ignited by a dry lightning storm. Over the course of 3 days, roughly 11,000 strikes sparked 367 fires in the area. Normally, lightning-produced wildfires of this magnitude are rare. It’s been more than a decade since the last “historic lightning siege.” Most fires in the Bay area, rather, are started by humans — a result of faulty power lines, arson, neglected campfires, cigarettes, etc. The 2020 “lightning siege” resulted in more than 1.1 million scorched acres in just 9 days, a fire footprint roughly the size of Rhode Island.6 Air pollution levels as a result of the fires caused several days of unhealthy air quality. San Francisco air quality and San Jose air quality were similarly affected.
In the coming years, Oakland wildfires will continue to present a difficult emission source to manage, particularly amidst warming temperatures. Until climate change is met with urgency, fire prevention must rely on the laborious task of clearing volatile debris and forest undergrowth by manual removal or low-intensity “prescribed fires.” An estimated 8-10 million acres currently require thinning and ‘prescribed burning’ according to The California Department of Forestry and Fire Prevention (CAL FIRE).7 It will take time, however, for such an ambitious target to be met, especially at the current clearance rate of a million acres a year. Until then, Oakland’s smoky skies will likely be part of a seasonal trend.
Is wildfire smoke in Oakland unhealthy?
Over the last 3 years, 5 of the most destructive wildfires in California have been in close proximity to Oakland, contributing to unhealthy air pollution levels in the Bay Area.8 Often, Oakland’s most severe pollution events are the direct result of wildfire smoke.
In November 2018, Oakland’s monthly AQI averaged 121, “unhealthy for sensitive groups” as a result of The Kincade Fire, Carr Fire, and Mendocino Complex Fire that collectively burned over 150,000 acres. This was the highest monthly average Oakland has experienced in recent history.
The August 2020 “lightning siege” fires have also produced toxic pollution spikes. On August 21st, 2020, Oakland averaged an AQI of 154, the highest rating of the year so far.
Elevated air pollution levels in Oakland, as a result of wildfires, are more likely to occur May through October, when conditions are particularly hot and dry. Follow Oakland air quality advisories at the top of this page for actionable insights for reducing pollution exposure.
+ Article Resources
[1] American Lung Association. (2020). State of the air – 2020.
[2] Current Results. (2020). Napa temperatures: averages by month.
[3] Smith C, et al. (2018, December 11). Oakland’s air quality problem: Can first-of-its-kind legislation solve it? Oakland North.
[4] Irfan U. (2020, August 21). What makes California’s current major wildfires so unusual. Vox.
[5] Ray S, et al. (2020, August 25). California’s new normal: How the climate crisis is fueling wildfires and changing life in the Golden State. East Bay Times.
[6] Andrew F, et al. (2020, August 23). 1.1 million acres burned in nine days in California, as new lightning-ignited blazes forecast into Monday. The Washington Post.
[7] Helvarg D. (2019, December 20). How will California prevent more mega-wildfire disasters? National Geographic.
أين أنظف جودة هواء في Oakland؟
- Oakland Zoo EDU0
- 52nd Street7
- Victor Avenue8
- Camden Street9
- 3110 Adeline Street12
- Golden Gate District12
- Montclair12
- Sequoyah Road13
- Park Lane14
- Sequoyah14
- 1140 66th Street16
- Berkeley Fire Station 516
- Paws and Claws16
- Sequoyah 216
- Ashmount Avenue17
- Glenview La Cresta17
- Harbord17
- Malcolm Avenue17
- Melville Drive17
- Merriewood17
- Piedmont Pines17
- Upper Dimond17
- 3945 Waterhouse Road18
- 5th Avenue18
- Castle Park Way18
- Glenview18
- Hillegass Avenue18
- Scotia Avenue18
- 82nd Avenue19
- Hoolyrood Drive19
- Lodge Court19
- 14225 Skyline Blvd20
- High Street20
- Caballo Hills21
- Clarendon Crescent21
- Lake Royal Apartments21
- 51 Eucalyptus Path22
- Bentley Hiller Campus22
- Burckhalter Elementary School (Oakland)22
- Gravatt Drive22
- MacArthur Blvd22
- Markham ES22
- Maybelle Avenue22
- Orange Street22
- Piedmont Avenue22
- Swainland Road22
- 114 Strathmoor Drive23
- Field Street23
- Hilltop Crescent23
- Oakdale Avenue23
- Redwood Heights23
- Sayre Drive23
- Woodminster23
- 1938-1998 98th Ave24
- 2506 Delmer St24
- Bushrod24
- Coliseum24
- Parkridge Drive24
- Redwood Heights Guido Cul De Sac24
- Windward Hill24
- Wisconsin-Norton24
- 4041 Laurel Ave25
- 998-900 Leo Way25
- Lakeshore25
- Lowrey Road25
- 1643 Grand View Dr26
- 598-400 Crofton Ave26
- Castle Drive26
- Crocker Highlands26
- Rosie's House26
- Sims Drive26
- 8121 Surrey Lane27
- Brookside Avenue27
- Burckhalter ES27
- Hannah Street27
- Lawton Avenue27
- 1467 Wellington Street28
- 61st Street28
- Bishop O’Dowd High28
- Bridge Avenue Fruitvale28
- Chabot Elementary School28
- Cleveland Heights28
- Hillegass Ave28
- Leona Heights28
- Locksley Avenue28
- William Street28
- 544 63rd Street29
- 5879 Skyline Boulevard29
- Castlemont High School29
- Holman Road29
- Hoover - Foster29
- The Head-Royce School29
- Fruitvale ES30
- Grand View Dr (outside)30
- Vernon Street30
- 5680-5684 Miles Ave31
- East Lake31
- Mid Skyline Boulevard31
- Sunnyhills and Hillcroft Circle31
- 22nd Avenue Outdoor32
- Chestnut Street32
- Claremont Hills 232
- Drury Road32
- Horace Mann ES32
- Oakland Academy of Knowledge (OAK) ES32
- 1226 32nd St33
- 3118-3176 35th Ave33
- 433-401 3rd St33
- 7027 Buckingham33
- Laurel ES33
- Life Academy HS33
- Manzanita Drive33
- Picardy33
- Prescott33
- Temple Sinai33
- The College Preparatory School33
- Think College Now/Cesar Chavez Education Center (Oakland)33
- Westlake Elementary School33
- 6820 Thornhill Drive34
- Global Family ES34
- Highland Community ES34
- Northwood Court34
- 1799-1601 Linden St35
- Bridges Academy ES35
- EnCompass Academy ES35
- Melrose Leadership Academy ES35
- Warwick Avenue35
- Coliseum College Prep HS36
- East Oakland Pride ES36
- Fruitvale Village36
- Harrison Street36
- Peralta Rockets and Fiber Works36
- Space Sciences Lab36
- Greenleaf ES37
- Sereno Circle37
- West Street & 43rd Street37
- Westfield Way37
- Allendale ES38
- Garfield ES38
- International Community ES38
- Manzanita Community ES38
- Urban Promise Academy MS38
- 6607-6501 Glen Oaks Way39
- 6886 Pinehaven Road39
- 6948 Ridgewood Drive39
- Curtis St39
- Frick United Academy of Language MS39
- Sobrante Road39
- Thornhill Drive39
- 2608 West St40
- Balsam Way40
- West Oakland-West End Commons140
- Franklin ES43
- Fremont High School43
- Acorn Woodland Elementary School (OUSD)44
- Ascot Place44
- Oakland East44
- Oakland High School (Oakland)44
- Haverhill Drive47
- Moore Drive49
- Burton Drive52
- Longwalk Drive52
- Manzanita at Villanova52
- Lincoln Elementary School53
- Linden St53


