

227.3K people follow this city

Full screen


Contributors
1
Stations
7
Contributors category
1
Government
0
Non-profit organization
0
Educational
0
Corporate
0
Individual
0
Anonymous
Most polluted air quality stations
| # | station | US AQI |
|---|---|---|
| 1 | VALANCIA-CENTRE | 48 |
| 2 | Valencia - Politecnic | 45 |
| 3 | Bulevard Sud | 42 |
| 4 | Valencia - Avd. Francia | 37 |
| 5 | Vivers | 36 |
| 6 | Valencia - Moli Del Sol | 34 |
| 7 | Pista de Silla | 30 |
Health Recommendations
 | Enjoy outdoor activities |
 | Open your windows to bring clean, fresh air indoors GET A MONITOR |
community highlight
Valencia most followed contributors

Become a contributor
Get an AirVisual Outdoor and contribute to collecting millions of data points for the Valencia map to track local air pollution
News
The latest air quality news and resources.


Understand air pollution and protect yourself


Valencia MAP AIR QUALITY ANALYSIS AND STATISTICS
What valuable information about air quality can be found on the air pollution map for Valencia?
The air pollution map for Valencia is very easy to access from the main city page. The map icon can be found towards the top of this main page, and by selecting the icon, a new page will open which has all the relevant information about the current air quality in and around Valencia.
When the map is first viewed, the overall colour of the background will be the first thing to notice. This colouration is an indication of the current air quality. It is currently green which would indicate “Good” air quality. If the map is slightly expanded, several coloured discs will begin to appear. These mark the position of the ground-level air monitoring stations. It should be noted that there are none over Valencia because the city relies on satellite information for its data about air quality.
The various colours used are standard throughout the entire IQAir website and range from pale green to dark maroon. The darker the colour, the worse the air quality. There is also a number displayed in the centre of the circle which is the US AQI reading for that area of the city. This is the United States Air Quality Index number and is universally recognised as a standard for air quality. It is calculated by taking measurements of up to six of the most prolific pollutants found in city air. These are usually both sizes of Particulate Matter (PM2.5 and PM10), ozone, nitrogen dioxide, sulphur dioxide and carbon monoxide. Once this figure is calculated, it is used as a metric when making comparisons in air quality between different cities across the globe. It is both encouraged and endorsed by the World Health Organisation (WHO).
Turning back to the main city page, within the coloured banner at the top is the US AQI number. When there is an asterisk to the right of the number, it indicates that the information is derived from overhead satellites. The data collected is comparable to that collected from physical stations at ground level.
During November 2022, the US AQI reading for Valencia was 17 which would indicate “Good” air quality. The main pollutant measured was PM2.5 with a recorded level of 4.1 µg/m³ which is within the target figure of 5 µg/m³ as recommended by the WHO.
How much more interesting information about air quality can be found on the air pollution map for Valencia?
There is more information on the air pollution map for Valencia, but in order to access it all, the page needs to be viewed in full-screen mode otherwise some information may remain hidden. The icon to view the page this way can be found at the top of the page.
Once in full-screen mode, a list of four options will be seen on the left-hand side of the page. Each of these choices can be turned on and off so as to get a better idea of what each one does.
The first option would show the location of the ground-level air monitoring stations, but as already stated, Valencia relies on satellite data because it has no physical stations.
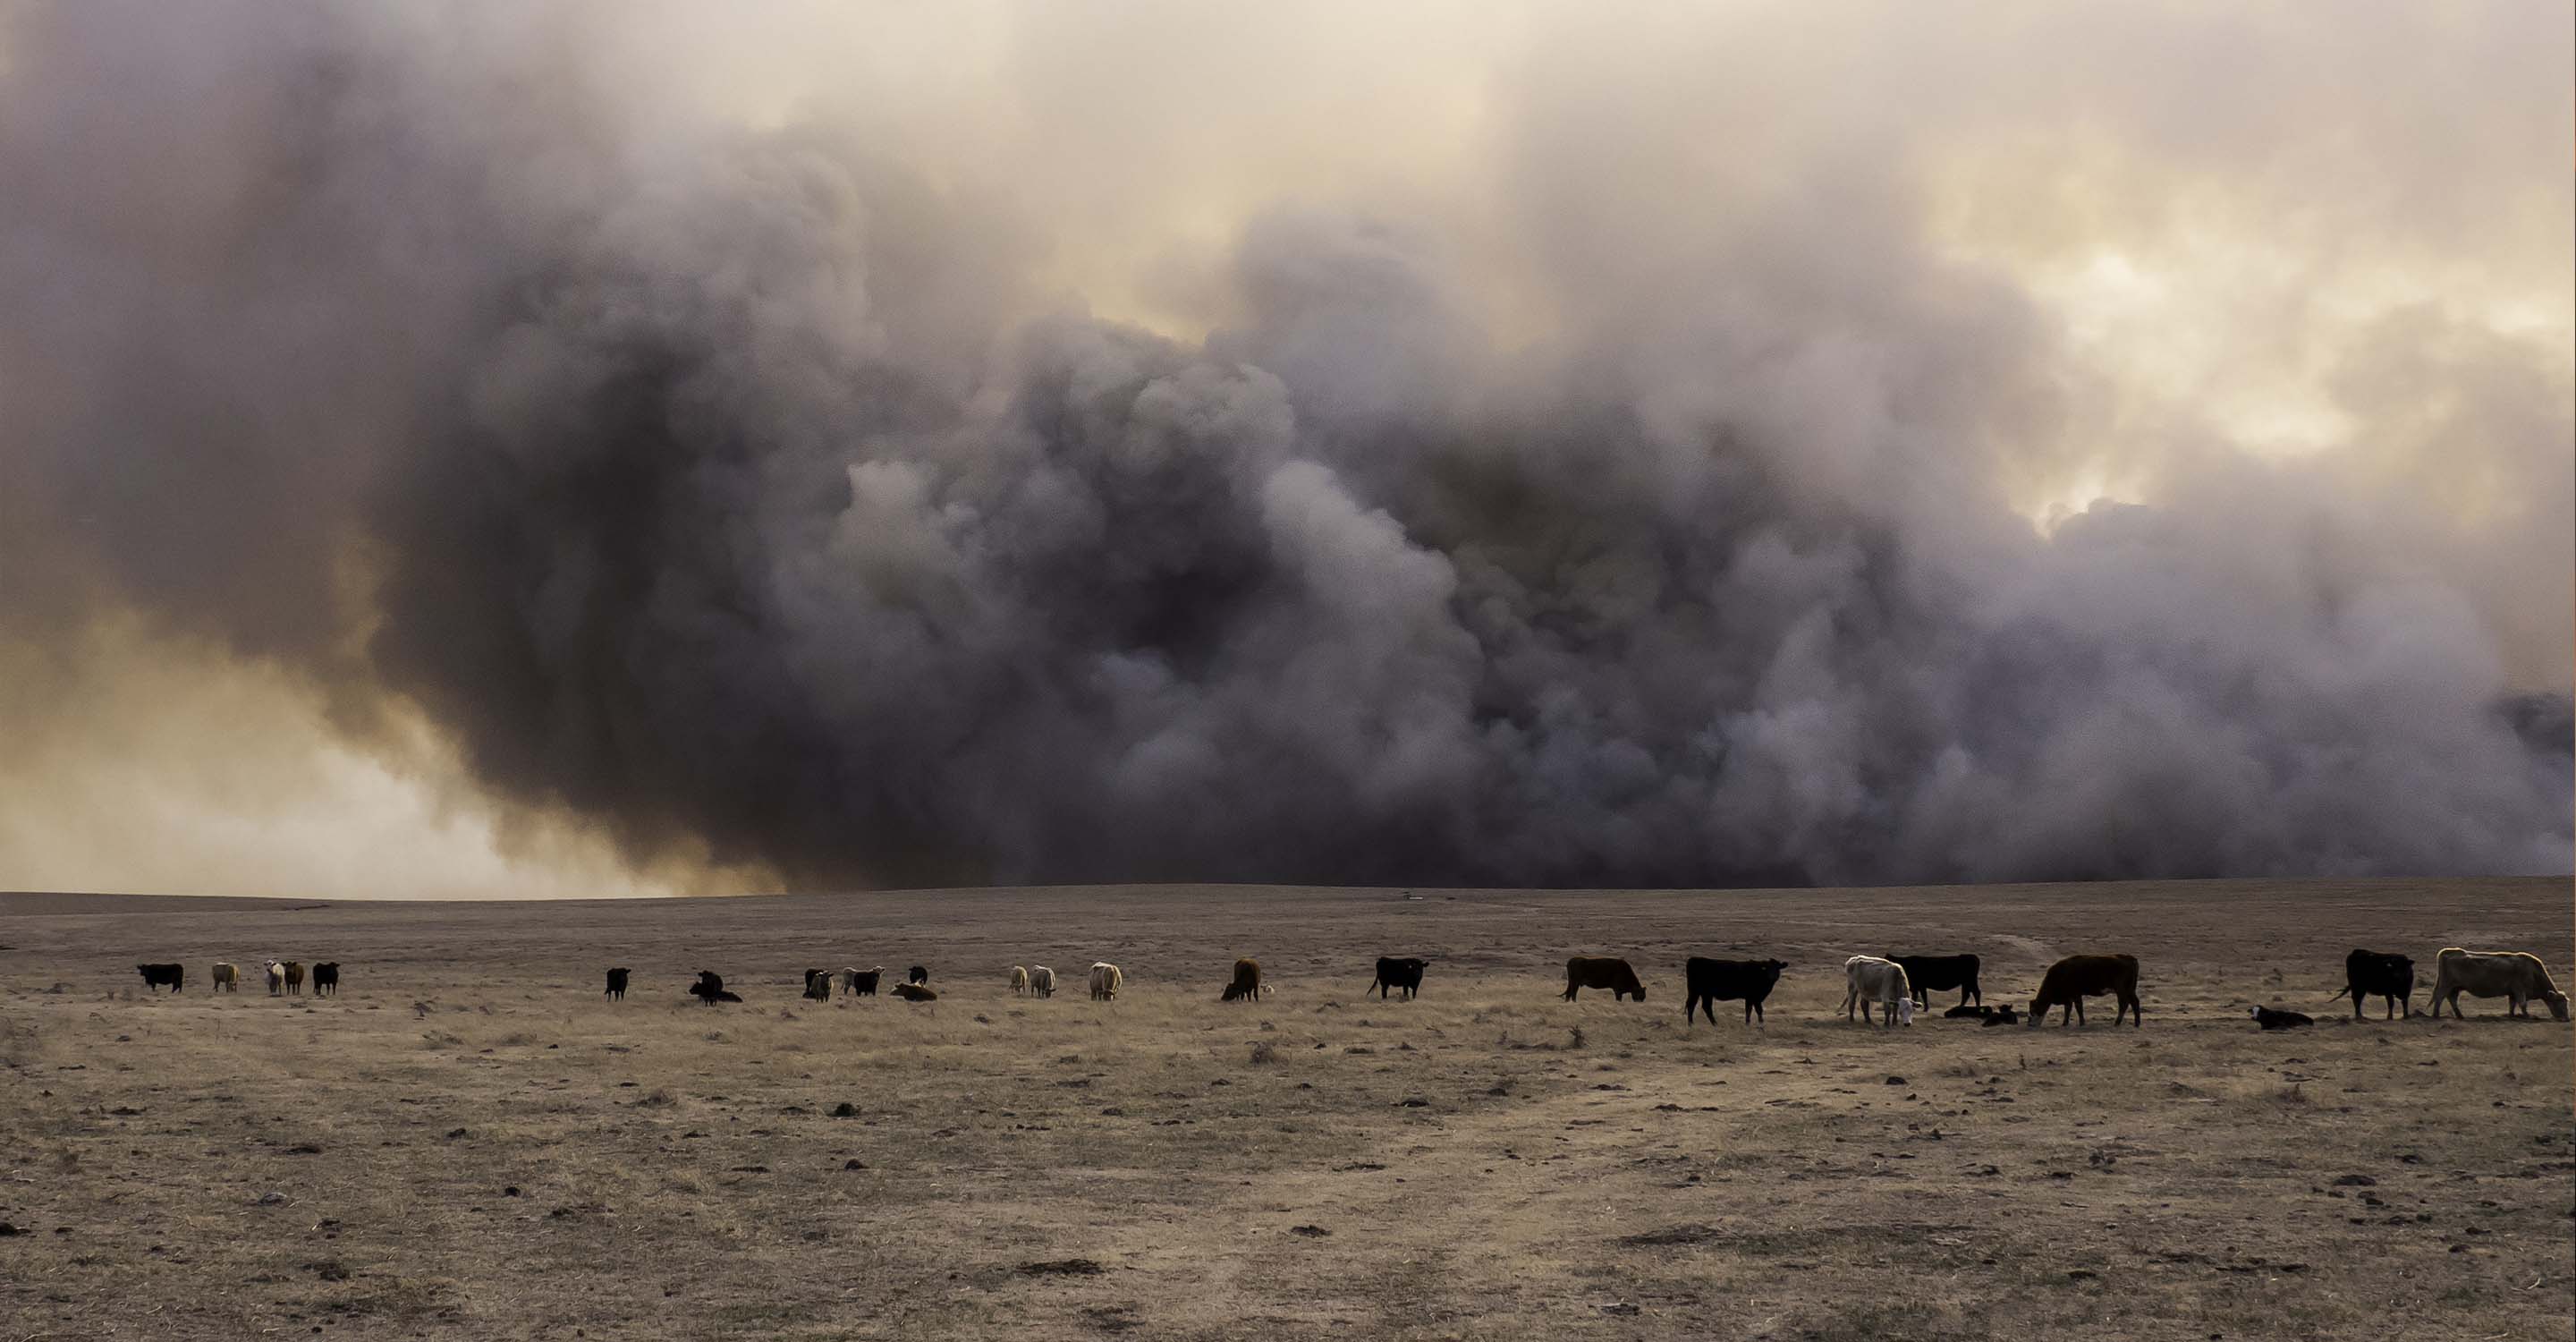
Option number two would show the location of any wildfires that happen to be burning in the vicinity of the city, however, in November 2022 there were no fires burning near the city. If fires were seen then option four needs to be consulted as it reveals the speed and direction of the prevailing winds and gives a good indication of where the ensuing smoke might blow.
Option number three is the most dramatic as it changes the overall colour of the map to indicate the current air quality. Some viewers may find this a little confusing, in which case, it can be deactivated and the map will revert to a standard set of colours.
There is even more information on the right-hand side of the screen in the form of a table. This lists world cities in order of their level of air pollution. By default, only seven cities are shown on the table but more cities can be seen by expanding the page to reveal more.
Can the source of the air pollution be seen on the air quality map for Valencia?
The source of the polluted air is not shown directly on the air pollution map for Valencia, however, it is believed that the main source of air pollution comes from vehicles using the city road network.
Valencia, especially in the centre, presents concentrations of air pollution that exceed the regulations and "acceptable levels for the protection of health", according to data from the local authority. The main cause is vehicle traffic. Air pollution is linked to respiratory and heart disease and an increased risk of cancer, experts say.
Air pollution is a mixture of solid particles and gases in the air. Vehicle exhaust, chemicals from factories, dust, pollen, and mould spores can all be suspended as particles. Ozone, a gas, is a fundamental component of air pollution in cities. When ozone forms air pollution it is also called smog.
Some air pollutants are toxic. Their inhalation can increase the chances of having health problems. People with heart or lung disease, older adults, and children are at higher risk of problems from air pollution. Air pollution doesn't just happen outside: the air inside buildings can also be polluted and affect your health.
PM2.5 is often used as a standard on the air pollution map for Valencia, but what is it?
PM2.5 particles are those particles whose diameter is equal to or less than 2.5 microns. A micron or micrometre is a unit of length that is equal to one thousandth of a millimetre, so these particles are undetectable to the human eye.
The origin of these particles is usually associated with human activity, but two major sources can be distinguished: primary or secondary.
The primary origin occurs mainly in the field of road traffic, industry, construction, agriculture or emissions related to heating buildings. In this case, the particles are emitted directly into the atmosphere.
The secondary origin of these particles is caused by chemical reactions in the atmosphere itself, which are generally caused by gases such as sulphur dioxide, oxides of nitrogen, ammonia and volatile organic compounds.
Valencia air quality data attribution
1Contributor
 ICA-Índice Nacional de Calidad del Aire
7 stations
Government Contributor
Where is the cleanest air quality in Valencia?


