Sasolburg air quality map
Live air pollution map of Sasolburg
1.4K people follow this city
Full screen
Contributors
1
Stations
1
Contributors category
1
Government
0
Non-profit organization
0
Educational
0
Corporate
0
Individual
0
Anonymous
Most polluted air quality stations
| # | station | US AQI |
|---|---|---|
| 1 | Zamdela | 153 |
community highlight
Sasolburg most followed contributors
Health Recommendations
| Avoid outdoor exercise | |
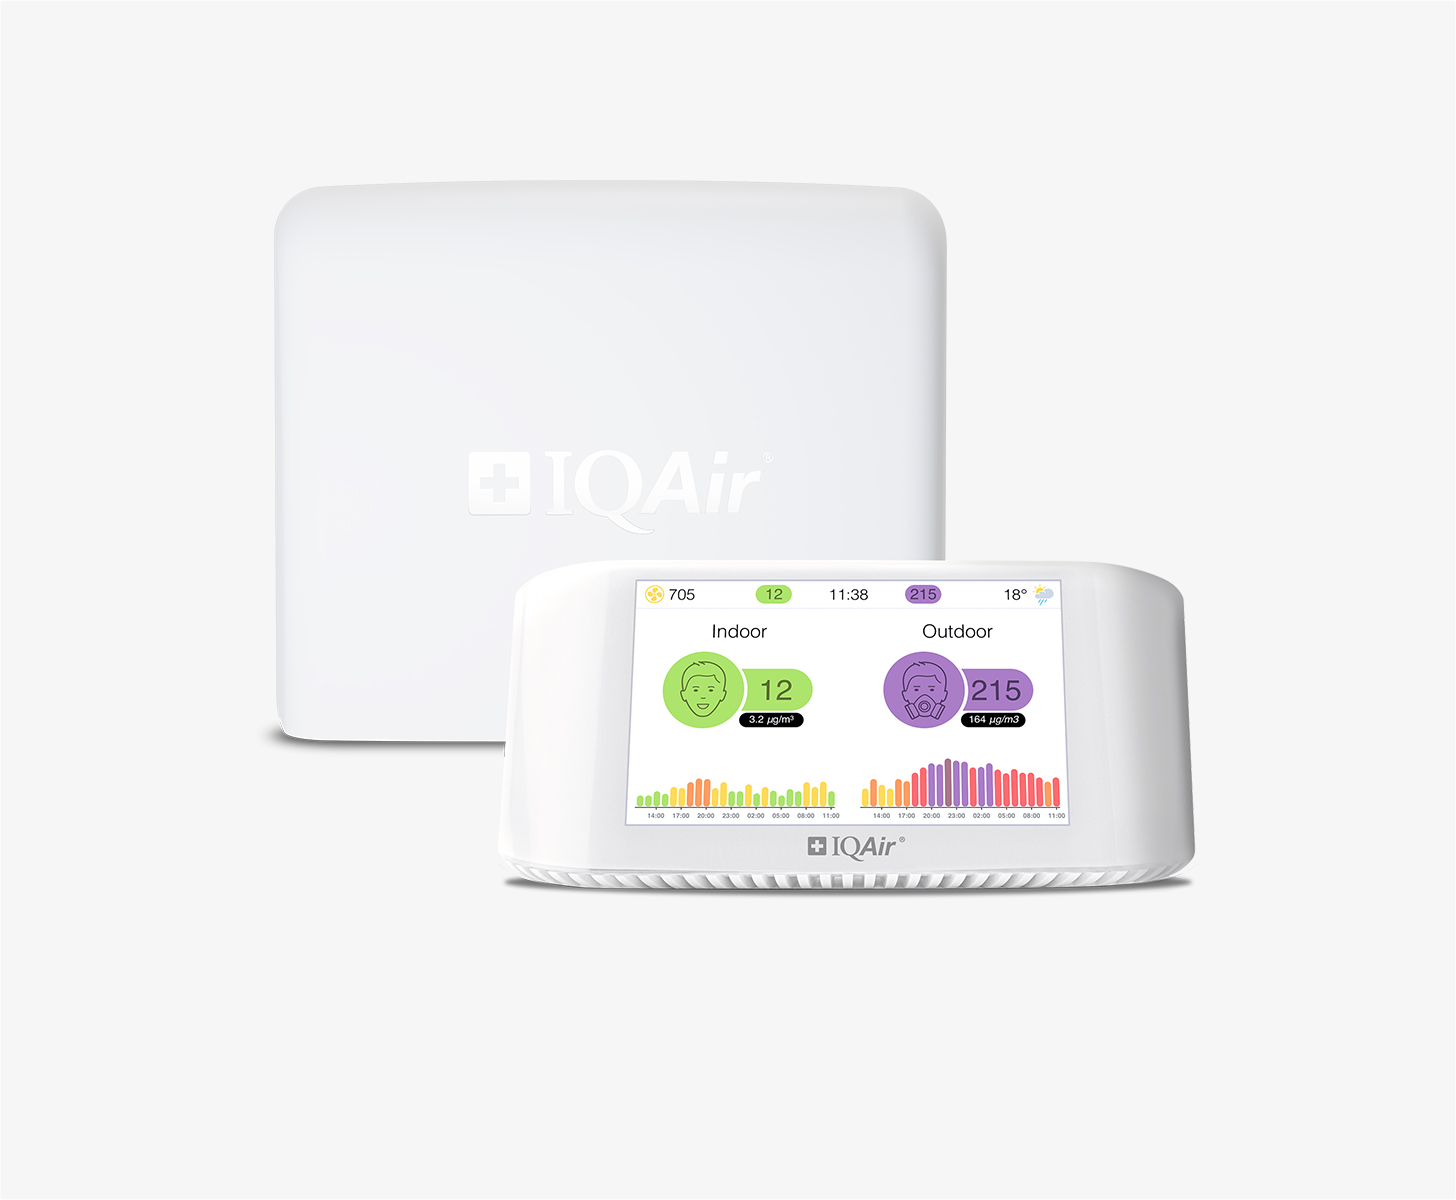
| Close your windows to avoid dirty outdoor air GET A MONITOR | |
| Wear a mask outdoors GET A MASK | |
| Run an air purifier GET AN AIR PURIFIER |
Become a contributor
Get an AirVisual Outdoor and contribute to collecting millions of data points for the Sasolburg map to track local air pollution
Understand air pollution and protect yourself
Sasolburg MAP AIR QUALITY ANALYSIS AND STATISTICS
What information about air quality is there on the air pollution map for Sasolburg?
There are a lot of interesting facts and figures about air pollution on the air quality map for Sasolburg and it is readily accessible from the main city page. The map icon acts as a link which, when selected, will re-open a new page filled with all the relevant information.
When this new page opens, the viewer will see a strong colour which is a direct way of showing the current air quality. Available colours range from pale green to dark maroon where the darker colours show worsening air quality. They are used as standard across the entire IQAir website and are fully explained in the legend at the foot of the page. The colour at present is orangey/brown which lets the viewer know that the air quality is “Unhealthy for Sensitive Groups”.
Some coloured discs will also be seen scattered across the map which represent the sites of the ground-level air quality monitoring stations. Some may not be under the supervision of Sasolburg. These stations provide the data about air quality and display a number at their centre. This number is the United States Air Quality Index reading or US AQI for short.
This figure is calculated by taking readings of up to six of the most prolific pollutants in the city air. They are usually both sizes of Particulate Matter (PM2.5 and PM10), ozone, nitrogen dioxide, sulphur dioxide and carbon monoxide. When the figure has been determined, it is used as a metric when comparing air quality in different areas across the globe. The entire system has the backing of the World Health Organisation (WHO). Each station can be further explored by selecting the one of interest which will then re-open the page which will be filled with information about that specific area. This can be very useful when travelling around the locality.
Going back to the main city page, in the coloured banner at the top of it will be seen the current level of air cleanliness. It shows both the US AQI reading and the coloured background is also an indication of air quality. The reading at present is 124 which categorises the quality as “Unhealthy for Sensitive Groups”. The main pollutant was found to be PM2.5 with a recorded level of 44.9 µg/m³ (microns per cubic metre) which is nine times higher than the suggested target figure of 5 µg/m³ as recommended by the WHO.
Immediately below the air pollution map for Sasolburg can be seen the number of contributors there are in the city that collect and collate the data about air quality. Currently, there is just one station operated by the government department known as the South African Air Quality Information System. This department operates fifty-two other stations across South Africa.
Is there much more fascinating information about air quality on the air pollution map for Sasolburg?
There is a lot more information about air quality on the air pollution map for Sasolburg. The page needs to be viewed in full-screen mode to reap the most advantages of all there is on offer. Selecting the icon at the top right-hand side of the page will re-open it at maximum size thus enabling all the information to be visible.
When viewed in this way there will be four options appear down the left-hand side of the screen. These can each be turned on or off individually to see the effect they have on the map.
The first option shows the positions of the ground-level air monitoring stations whether or not they are under the jurisdiction of the city. All of these stations can be individually explored because they are all filled with information about that specific area.
The second option shows the locations of any wildfires there are that are burning out of control in the area. At the time of writing in April 2023, there was one fire icon on the map directly north of Sasolburg. However, after consulting option number four which shows the speed and direction of the prevailing winds, it can be seen that the wind is blowing in a northerly direction and will therefore carry any smoke away from the city.
Option number three changes the background colour of the map to visually show the current state of the air. If it is a dark colour, it might be distracting, in which case, it can be deactivated to allow the natural set of colours to appear on the map.
More facts and figures about air pollution can be found on the right-hand side of the page where the top seven most polluted world cities are listed in the form of a table. The rest of the participating cities can be seen in the full ranking section which contains many pages which show them in descending order.
Looking directly below the contributor’s category can be seen a list of the most polluted air quality stations, according to their US AQI reading. When there is only one station, the list is very short. The station at Zamdela recorded a figure of 124 which is classified as being “Unhealthy for sensitive groups”.
The next list shows the stations in order of their popularity. Zamdela, by no surprise, is the most popular with a total of 682 loyal followers.
Can the source of the polluted air be identified on the air quality map for Sasolburg?
Whilst the direct source of the air pollution is not shown directly on the air pollution map for Sasolburg, it is well-known that emissions from residential solid fuel fires in highly populated settlements are a significant source of air pollution. The area is densely populated and highly industrialised, resulting in high concentrations of pollutants in the area. Although emissions from industrial sources are much larger, exposure to household emissions poses a significant risk to human health. Interventions aimed at reducing solid fuel burning in low-income settlements have the potential to reduce exposure.
PM2.5 is often quoted on the air pollution map for Sasolburg, but how dangerous is it?
Short-term exposures to PM10 have been associated primarily with the worsening of respiratory diseases, including asthma and chronic obstructive pulmonary disease (COPD), leading to hospitalisation and visits to the doctor.
Long-term exposure to PM2.5 has been linked to premature death, particularly in people who have chronic heart or lung diseases, and reduced lung function growth in children. The effects of long-term exposure to PM10 are less clear, although several studies suggest a link between long-term PM10 exposure and respiratory mortality. The International Agency for Research on Cancer (IARC) published a review in 2015 that concluded that particulate matter in outdoor air pollution causes lung cancer.
Sasolburg air quality data attribution
1Contributor
Government Contributor
1 Data source


