MondeArrow icon
Arrow iconShenzhen

Qualité de l’air à Shenzhen

Indice de qualité de l’air (IQA⁺) et pollution de l’air (PM2.5) à Shenzhen • 865.1K Abonnés • 20:00, oct. 05 Heure locale

33

IQA⁺ US

Bon

face expression based on aqi value

Polluant principal:

PM2.5

6 µg/m³

weather condition icon

25°

wind direction icon

20 km/h

weather humid icon

67 %

Prévisions horaires

Prévision de l’indice de qualité de l’air (IQA⁺) à Shenzhen

Maintenant

33

Icône météo

25°

Carte de qualité d'air IQAir AirVisual - Vent pivotant à {{number} }degré

20

km/h

Icône d'humidité

67%

21:00

36

Icône météo

24°

Carte de qualité d'air IQAir AirVisual - Vent pivotant à {{number} }degré

20

km/h

Icône d'humidité

66%

22:00

40

Icône météo

24°

Carte de qualité d'air IQAir AirVisual - Vent pivotant à {{number} }degré

21

km/h

Icône d'humidité

66%

23:00

44

Icône météo

23°

Carte de qualité d'air IQAir AirVisual - Vent pivotant à {{number} }degré

21

km/h

Icône d'humidité

65%

mar.

00:00

48

Icône météo

23°

Carte de qualité d'air IQAir AirVisual - Vent pivotant à {{number} }degré

20

km/h

Icône d'humidité

66%

01:00

52

Icône météo

23°

Carte de qualité d'air IQAir AirVisual - Vent pivotant à {{number} }degré

19

km/h

Icône d'humidité

66%

02:00

57

Icône météo

22°

Carte de qualité d'air IQAir AirVisual - Vent pivotant à {{number} }degré

18

km/h

Icône d'humidité

65%

03:00

60

Icône météo

22°

Carte de qualité d'air IQAir AirVisual - Vent pivotant à {{number} }degré

17

km/h

Icône d'humidité

64%

04:00

63

Icône météo

22°

Carte de qualité d'air IQAir AirVisual - Vent pivotant à {{number} }degré

15

km/h

Icône d'humidité

64%

05:00

67

Icône météo

22°

Carte de qualité d'air IQAir AirVisual - Vent pivotant à {{number} }degré

14

km/h

Icône d'humidité

64%

06:00

71

Icône météo

22°

Carte de qualité d'air IQAir AirVisual - Vent pivotant à {{number} }degré

13

km/h

Icône d'humidité

62%

07:00

74

Icône météo

22°

Carte de qualité d'air IQAir AirVisual - Vent pivotant à {{number} }degré

13

km/h

Icône d'humidité

61%

08:00

78

Icône météo

22°

Carte de qualité d'air IQAir AirVisual - Vent pivotant à {{number} }degré

14

km/h

Icône d'humidité

60%

09:00

79

Icône météo

23°

Carte de qualité d'air IQAir AirVisual - Vent pivotant à {{number} }degré

16

km/h

Icône d'humidité

56%

10:00

80

Icône météo

24°

Carte de qualité d'air IQAir AirVisual - Vent pivotant à {{number} }degré

16

km/h

Icône d'humidité

52%

11:00

81

Icône météo

25°

Carte de qualité d'air IQAir AirVisual - Vent pivotant à {{number} }degré

15

km/h

Icône d'humidité

50%

12:00

85

Icône météo

26°

Carte de qualité d'air IQAir AirVisual - Vent pivotant à {{number} }degré

15

km/h

Icône d'humidité

50%

13:00

90

Icône météo

25°

Carte de qualité d'air IQAir AirVisual - Vent pivotant à {{number} }degré

15

km/h

Icône d'humidité

51%

14:00

95

Icône météo

25°

Carte de qualité d'air IQAir AirVisual - Vent pivotant à {{number} }degré

16

km/h

Icône d'humidité

51%

15:00

93

Icône météo

25°

Carte de qualité d'air IQAir AirVisual - Vent pivotant à {{number} }degré

15

km/h

Icône d'humidité

52%

16:00

91

Icône météo

25°

Carte de qualité d'air IQAir AirVisual - Vent pivotant à {{number} }degré

15

km/h

Icône d'humidité

53%

17:00

89

Icône météo

25°

Carte de qualité d'air IQAir AirVisual - Vent pivotant à {{number} }degré

14

km/h

Icône d'humidité

55%

18:00

87

Icône météo

25°

Carte de qualité d'air IQAir AirVisual - Vent pivotant à {{number} }degré

12

km/h

Icône d'humidité

55%

19:00

85

Icône météo

25°

Carte de qualité d'air IQAir AirVisual - Vent pivotant à {{number} }degré

10

km/h

Icône d'humidité

56%

20:00

83

Icône météo

25°

Carte de qualité d'air IQAir AirVisual - Vent pivotant à {{number} }degré

8

km/h

Icône d'humidité

57%

21:00

81

Icône météo

25°

Carte de qualité d'air IQAir AirVisual - Vent pivotant à {{number} }degré

12

km/h

Icône d'humidité

55%

22:00

79

Icône météo

25°

Carte de qualité d'air IQAir AirVisual - Vent pivotant à {{number} }degré

15

km/h

Icône d'humidité

55%

23:00

77

Icône météo

24°

Carte de qualité d'air IQAir AirVisual - Vent pivotant à {{number} }degré

14

km/h

Icône d'humidité

56%

mer.

00:00

81

Icône météo

24°

Carte de qualité d'air IQAir AirVisual - Vent pivotant à {{number} }degré

13

km/h

Icône d'humidité

56%

01:00

85

Icône météo

24°

Carte de qualité d'air IQAir AirVisual - Vent pivotant à {{number} }degré

12

km/h

Icône d'humidité

56%

02:00

90

Icône météo

23°

Carte de qualité d'air IQAir AirVisual - Vent pivotant à {{number} }degré

10

km/h

Icône d'humidité

56%

03:00

88

Icône météo

23°

Carte de qualité d'air IQAir AirVisual - Vent pivotant à {{number} }degré

9

km/h

Icône d'humidité

55%

04:00

86

Icône météo

23°

Carte de qualité d'air IQAir AirVisual - Vent pivotant à {{number} }degré

8

km/h

Icône d'humidité

56%

05:00

84

Icône météo

23°

Carte de qualité d'air IQAir AirVisual - Vent pivotant à {{number} }degré

8

km/h

Icône d'humidité

57%

06:00

82

Icône météo

22°

Carte de qualité d'air IQAir AirVisual - Vent pivotant à {{number} }degré

9

km/h

Icône d'humidité

57%

07:00

80

Icône météo

22°

Carte de qualité d'air IQAir AirVisual - Vent pivotant à {{number} }degré

10

km/h

Icône d'humidité

57%

08:00

78

Icône météo

23°

Carte de qualité d'air IQAir AirVisual - Vent pivotant à {{number} }degré

13

km/h

Icône d'humidité

51%

09:00

78

Icône météo

25°

Carte de qualité d'air IQAir AirVisual - Vent pivotant à {{number} }degré

14

km/h

Icône d'humidité

48%

10:00

78

Icône météo

26°

Carte de qualité d'air IQAir AirVisual - Vent pivotant à {{number} }degré

12

km/h

Icône d'humidité

46%

11:00

78

Icône météo

27°

Carte de qualité d'air IQAir AirVisual - Vent pivotant à {{number} }degré

10

km/h

Icône d'humidité

45%

12:00

82

Icône météo

28°

Carte de qualité d'air IQAir AirVisual - Vent pivotant à {{number} }degré

9

km/h

Icône d'humidité

45%

13:00

86

Icône météo

28°

Carte de qualité d'air IQAir AirVisual - Vent pivotant à {{number} }degré

8

km/h

Icône d'humidité

44%

14:00

90

Icône météo

29°

Carte de qualité d'air IQAir AirVisual - Vent pivotant à {{number} }degré

7

km/h

Icône d'humidité

44%

15:00

89

Icône météo

29°

Carte de qualité d'air IQAir AirVisual - Vent pivotant à {{number} }degré

6

km/h

Icône d'humidité

46%

16:00

88

Icône météo

28°

Carte de qualité d'air IQAir AirVisual - Vent pivotant à {{number} }degré

7

km/h

Icône d'humidité

47%

17:00

87

Icône météo

28°

Carte de qualité d'air IQAir AirVisual - Vent pivotant à {{number} }degré

8

km/h

Icône d'humidité

50%

18:00

87

Icône météo

27°

Carte de qualité d'air IQAir AirVisual - Vent pivotant à {{number} }degré

8

km/h

Icône d'humidité

54%

19:00

88

Icône météo

27°

Carte de qualité d'air IQAir AirVisual - Vent pivotant à {{number} }degré

10

km/h

Icône d'humidité

61%

20:00

89

Icône météo

26°

Carte de qualité d'air IQAir AirVisual - Vent pivotant à {{number} }degré

11

km/h

Icône d'humidité

70%

21:00

82

Icône météo

25°

Carte de qualité d'air IQAir AirVisual - Vent pivotant à {{number} }degré

10

km/h

Icône d'humidité

72%

22:00

76

Icône météo

25°

Carte de qualité d'air IQAir AirVisual - Vent pivotant à {{number} }degré

10

km/h

Icône d'humidité

72%

23:00

70

Icône météo

25°

Carte de qualité d'air IQAir AirVisual - Vent pivotant à {{number} }degré

9

km/h

Icône d'humidité

73%

jeu.

00:00

67

Icône météo

25°

Carte de qualité d'air IQAir AirVisual - Vent pivotant à {{number} }degré

9

km/h

Icône d'humidité

75%

01:00

65

Icône météo

25°

Carte de qualité d'air IQAir AirVisual - Vent pivotant à {{number} }degré

9

km/h

Icône d'humidité

75%

02:00

63

Icône météo

24°

Carte de qualité d'air IQAir AirVisual - Vent pivotant à {{number} }degré

9

km/h

Icône d'humidité

73%

03:00

62

Icône météo

24°

Carte de qualité d'air IQAir AirVisual - Vent pivotant à {{number} }degré

9

km/h

Icône d'humidité

73%

04:00

61

Icône météo

24°

Carte de qualité d'air IQAir AirVisual - Vent pivotant à {{number} }degré

9

km/h

Icône d'humidité

72%

05:00

61

Icône météo

23°

Carte de qualité d'air IQAir AirVisual - Vent pivotant à {{number} }degré

9

km/h

Icône d'humidité

72%

06:00

61

Icône météo

23°

Carte de qualité d'air IQAir AirVisual - Vent pivotant à {{number} }degré

8

km/h

Icône d'humidité

73%

07:00

61

Icône météo

23°

Carte de qualité d'air IQAir AirVisual - Vent pivotant à {{number} }degré

9

km/h

Icône d'humidité

71%

08:00

61

Icône météo

24°

Carte de qualité d'air IQAir AirVisual - Vent pivotant à {{number} }degré

10

km/h

Icône d'humidité

67%

09:00

62

Icône météo

25°

Carte de qualité d'air IQAir AirVisual - Vent pivotant à {{number} }degré

11

km/h

Icône d'humidité

62%

10:00

64

Icône météo

26°

Carte de qualité d'air IQAir AirVisual - Vent pivotant à {{number} }degré

11

km/h

Icône d'humidité

57%

11:00

66

Icône météo

27°

Carte de qualité d'air IQAir AirVisual - Vent pivotant à {{number} }degré

10

km/h

Icône d'humidité

54%

12:00

66

Icône météo

28°

Carte de qualité d'air IQAir AirVisual - Vent pivotant à {{number} }degré

8

km/h

Icône d'humidité

50%

13:00

67

Icône météo

28°

Carte de qualité d'air IQAir AirVisual - Vent pivotant à {{number} }degré

7

km/h

Icône d'humidité

48%

14:00

68

Icône météo

28°

Carte de qualité d'air IQAir AirVisual - Vent pivotant à {{number} }degré

3

km/h

Icône d'humidité

47%

15:00

68

Icône météo

28°

Carte de qualité d'air IQAir AirVisual - Vent pivotant à {{number} }degré

1

km/h

Icône d'humidité

48%

16:00

68

Icône météo

28°

Carte de qualité d'air IQAir AirVisual - Vent pivotant à {{number} }degré

0

km/h

Icône d'humidité

51%

17:00

69

Icône météo

27°

Carte de qualité d'air IQAir AirVisual - Vent pivotant à {{number} }degré

2

km/h

Icône d'humidité

53%

18:00

67

Icône météo

27°

Carte de qualité d'air IQAir AirVisual - Vent pivotant à {{number} }degré

8

km/h

Icône d'humidité

55%

19:00

65

Icône météo

26°

Carte de qualité d'air IQAir AirVisual - Vent pivotant à {{number} }degré

12

km/h

Icône d'humidité

57%

Prévisions quotidiennes

|

Prévision de l’indice de qualité de l’air (IQA⁺) à Shenzhen

Polluants atmosphériques

Quelle est la qualité de l’air actuellement à Shenzhen?

Icône d'exclamation IQAir

La concentration de PM2,5 est actuellement 1.2 fois la valeur seuil annuelle de l'OMS pour les particules PM2,5.

Recommandations de santé

Protégez-vous de la pollution de l’air à Shenzhen

SHOP IQAIR PRODUCTS

Surveillez l'air que vous respirez

Obtenez des relevés précis de la qualité de l'air AirVisual et des informations en temps réel pour un air plus pur. Les moniteurs révèlent les sources de pollution et indiquent quand il est nécessaire d'utiliser un purificateur d'air.

AirVisual Series

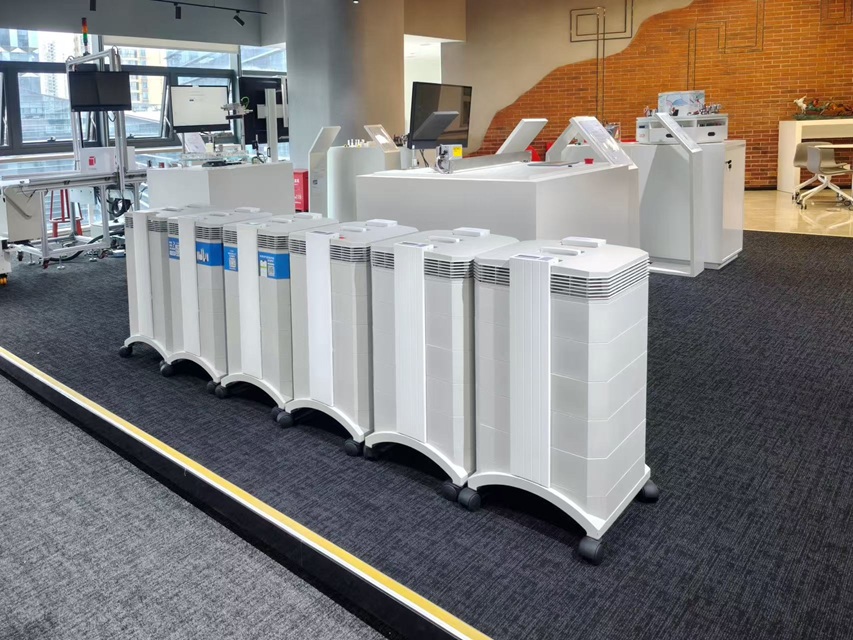
Purificateurs d'air de qualité médicale

Reconnue dans le monde entier, la série HealthPro Series utilise la technologie HyperHEPA. Elle filtre les particules ultrafines que les autres purificateurs d'air ne parviennent pas à détecter, offrant ainsi une protection de qualité médicale.

HealthPro Series

Des purificateurs d'air puissants et élégants

Compacte et puissante, la série Atem associe l'ingénierie suisse à une purification de l'air haute performance, filtrant les particules ultrafines grâce à la technologie HyperHEPA.

Série Atem

Pollen forecast

Aujourd’hui

Pollen china icon

Very Low

Less likely to trigger allergic reactions

Prévisions de pollen à Shenzhen

Recommandations de santé

Pollen forecast

Aujourd’hui

Pollen china icon

Very Low

Less likely to trigger allergic reactions

Prévisions de pollen à Shenzhen

Protégez-vous de la pollution de l’air à Shenzhen

SHOP IQAIR PRODUCTS

Surveillez l'air que vous respirez

Obtenez des relevés précis de la qualité de l'air AirVisual et des informations en temps réel pour un air plus pur. Les moniteurs révèlent les sources de pollution et indiquent quand il est nécessaire d'utiliser un purificateur d'air.

AirVisual Series

Purificateurs d'air de qualité médicale

Reconnue dans le monde entier, la série HealthPro Series utilise la technologie HyperHEPA. Elle filtre les particules ultrafines que les autres purificateurs d'air ne parviennent pas à détecter, offrant ainsi une protection de qualité médicale.

HealthPro Series

Des purificateurs d'air puissants et élégants

Compacte et puissante, la série Atem associe l'ingénierie suisse à une purification de l'air haute performance, filtrant les particules ultrafines grâce à la technologie HyperHEPA.

Série Atem

Endroits les plus pollués près de Shenzhen

Classement IQA⁺ mondialArrow icon

Classement des stations

Classement IQA⁺ des stations en direct pour les stations à Shenzhen

#StationsIQA⁺ US
1
Le drapeau national de China

Henggang

55

2
Le drapeau national de China

Nanhai Substation

53

3
Le drapeau national de China

Nan'ao

44

4
Le drapeau national de China

Dongguan City Jiaoyu Road No. 1

39

5
Le drapeau national de China

Guanlan

39

6
Le drapeau national de China

Meisha

33

7
Le drapeau national de China

Kuiyong

26

8
Le drapeau national de China

Overseas Chinese Town

23

9
Le drapeau national de China

Dongguan City Changyi Road No. 1

22

10
Le drapeau national de China

Honghu

20

Classement des villes

Classement IQA⁺ en temps réel de la ville : China

#VillesIQA⁺ US
1
Le drapeau national de China

Kashgar, Xinjiang

175

2
Le drapeau national de China

Kizilsu, Xinjiang

174

3
Le drapeau national de China

Linfen, Shanxi

139

4
Le drapeau national de China

Suining, Sichuan

119

5
Le drapeau national de China

Hebi, Henan

102

6
Le drapeau national de China

Mianyang, Sichuan

97

7
Le drapeau national de China

Guangan, Sichuan

96

8
Le drapeau national de China

Kaifeng, Henan

94

9
Le drapeau national de China

Weinan, Shaanxi

94

10
Le drapeau national de China

Ningbo, Zhejiang

93

Historique

Graphique de l’historique de la qualité de l’air à Shenzhen

33 IQA⁺ US
Bon
20:00–21:00 05 oct. Heure locale
IQA⁺ US

Historique

Graphique de l’historique de la qualité de l’air à Shenzhen

33 IQA⁺ US
Bon
20:00–21:00 05 oct. Heure locale
IQA⁺ US

Endroits les plus pollués près de Shenzhen

Classement IQA⁺ mondialArrow icon

Classement des stations

Classement IQA⁺ des stations en direct pour les stations à Shenzhen

#StationsIQA⁺ US
1
Le drapeau national de China

Henggang

55

2
Le drapeau national de China

Nanhai Substation

53

3
Le drapeau national de China

Nan'ao

44

4
Le drapeau national de China

Dongguan City Jiaoyu Road No. 1

39

5
Le drapeau national de China

Guanlan

39

6
Le drapeau national de China

Meisha

33

7
Le drapeau national de China

Kuiyong

26

8
Le drapeau national de China

Overseas Chinese Town

23

9
Le drapeau national de China

Dongguan City Changyi Road No. 1

22

10
Le drapeau national de China

Honghu

20

Classement des villes

Classement IQA⁺ en temps réel de la ville : China

#VillesIQA⁺ US
1
Le drapeau national de China

Kashgar, Xinjiang

175

2
Le drapeau national de China

Kizilsu, Xinjiang

174

3
Le drapeau national de China

Linfen, Shanxi

139

4
Le drapeau national de China

Suining, Sichuan

119

5
Le drapeau national de China

Hebi, Henan

102

6
Le drapeau national de China

Mianyang, Sichuan

97

7
Le drapeau national de China

Guangan, Sichuan

96

8
Le drapeau national de China

Kaifeng, Henan

94

9
Le drapeau national de China

Weinan, Shaanxi

94

10
Le drapeau national de China

Ningbo, Zhejiang

93

Measure your own air quality

Get a monitor and contribute air quality data in your city.

Quelle est la qualité de l'air actuelle à Shenzhen ?

La qualité de l'air actuelle à Shenzhen est considérée comme bonne. L'air est pur et présente peu ou pas de risque pour la santé.

What is the air quality index of Shenzhen?

Shenzhen is a very large sub-provincial city situated on the east bank of the Pearl River in southern China. It is part of the Pearl River Delta megapolis with Hong Kong being its southern neighbour. In 2017 the estimated population was almost 13 million, but it was thought to be nearer 20 million when transient people were taken into account.

Towards the end of 2020, Shenzhen was experiencing a “Moderate” level of air quality with a US AQI figure of 61. The concentration of the other recorded airborne pollutants were as follows : - PM2.5 was 18 µg/m³, PM10 - 54 µg/m³, ozone (O3) - 64.5 µg/m³, nitrogen dioxide (CO2) - 24 µg/m³, sulphur dioxide (SO2) - 24 µg/m³ and carbon monoxide (CO) - 24 µg/m³.

In 2019, the average annual recording was 23.4 µg/m³, which again, classes it as “Moderate”. This is based on the recommended figures supplied by the World Health Organisation (WHO). During the month of June, Shenzhen achieved the WHO target figure of 10 µg/m³ or less. For November, December and January the figures were “Unhealthy for sensitive groups” with figures ranging from 35.5 to 55.4 µg/m³. For the remaining 8 months of the year, the figure was classified as “Moderate” with figures between 12.1 and 35.4 µg/m³.

What are the main sources of Shenzhen’s polluted air?

The engineering industry is a major source of pollution in Shenzhen. Emissions include black carbon (BC), sulphur oxides (SOx), nitrogen oxides (NOx), carbon monoxide (CO) and carbon dioxide (CO2) organic compounds, halides, other VOCs. Some of them are smoke and dust, and some are gases.

Domestic stoves and heating boilers often consume a large amount of coal, especially the older inefficient ones. During the combustion process, coal releases a large amount of dust, sulphur dioxide (SO2), carbon monoxide (CO) and other harmful substances to pollute the atmosphere. Especially when heating in winter, the polluted areas are often filled with smog, making people cough, which is also a source of pollution that cannot be ignored.

Automobiles, trucks, trains, aeroplanes and ships are the main means of transportation in modern times, and the waste gas produced by burning coal or oil is also a major pollutant. In particular, the number of cars in cities is large and the pollutants emitted can directly attack human respiratory organs, causing serious air pollution.

Is air pollution in Shenzhen getting better or worse?

Recently, the quality of air in Shenzhen has worsened significantly, and the days of haze have continued, causing much public concern. It was said that due to adverse weather conditions, Shenzhen experienced mild air pollution for several days, and the primary pollutant was found to be ozone (O3). In order to alleviate air pollution, Shenzhen has launched comprehensive measures in order to try and redress the situation.

According to reports, the recent decline in the air quality is due to the impact of two successive typhoons. The temperature near the ground in Shenzhen is mainly high with a stable and weak northerly wind making the conditions for the diffusion of atmospheric pollutants very poor, and this is conducive to the occurrence of atmospheric photochemical reactions especially with ozone. Under the influence of unfavourable weather conditions, the city's air quality has deteriorated significantly since August 27, with pollution lasting for several days. According to recorded data, since 27th August, Shenzhen’s AQI (air quality index) value has exceeded 100 for 4 days, which are 108 (28th August), 139 (29th August), 126 (1st September) and 138 (2nd September), where all days were classed as being polluted.

What can be done to improve the air quality in Shenzhen?

When looking at ways of reducing pollution for industrial enterprises, 990 key businesses involving VOCs have been inspected, and 7 of them have been further investigated and suggestions made. They have been urged to strengthen the control of unorganised emissions to ensure compliance with the stated standards. At the same time, other key enterprises that use VOCs solvents such as packaging and printing, surface coating, furniture manufacturing, and plastic products were asked to change their working patterns to a shift system.

In terms of emission reduction measures for mobile sources, mobile monitoring units are carrying out spot checks on random vehicles’ exhaust systems and severely deal with the owners of such vehicles exceeding the standard. At the same time, checks are being carried out on non-road mobile machinery and to implement the low-emission zone policy, as required.119 construction sites were inspected in the low-emission zone, and 14 non-road pieces of machinery were found to be below the recommended levels and arrangements made to have them removed. 192 gas stations were inspected and the quality of fuel on sale was checked. Port authorities were reminded to make all ships in port use shore power and not continue running their engines to generate power.

In order to reduce the dust emissions within the city, inspections of construction sites, material terminals and storage yards were increased, and 182 construction sites were ordered to rectify problems and one storage yard was temporarily closed. At the same time, the frequency of road cleaning was to be increased.

What are the effects on health through breathing in Shenzhen’s polluted air?

Particulate Matter is a complex mixture that may contain soot, smoke, metals, nitrates, sulphates, dust, water, tyre rubber and dust given off by the braking system of vehicles. It can be directly emitted, as in smoke from a fire, or it can form in the atmosphere from reactions of gases such as nitrogen oxide (NO).

PM2.5 are possibly the worst pollutant as they have the ability to bypass the body’s defence system and enter the lungs where they cause irreparable damage. Long-term exposure to polluted air leads to many types of medical problems. Increased respiratory symptoms, such as irritation of the airways, coughing, wheezing or difficulty breathing can be a direct result of poor quality air. Chronic bronchitis or chronic obstructive lung disease (COPD) are much more prevalent in areas of polluted air. They can also be the number one cause of premature death for people with heart or lung disease. It is often associated with some types of cancer, too.