Tehran air quality map
Live air pollution map of Tehran
1M people follow this city
Full screen
Contributors
1
Stations
1
Contributors category
1
Government
0
Non-profit organization
0
Educational
0
Corporate
0
Individual
0
Anonymous
Most polluted air quality stations
| # | station | US AQI |
|---|---|---|
| 1 | Tehran-Farmanie | 74 |
community highlight
Tehran most followed contributors
Health Recommendations
| Sensitive groups should reduce outdoor exercise | |
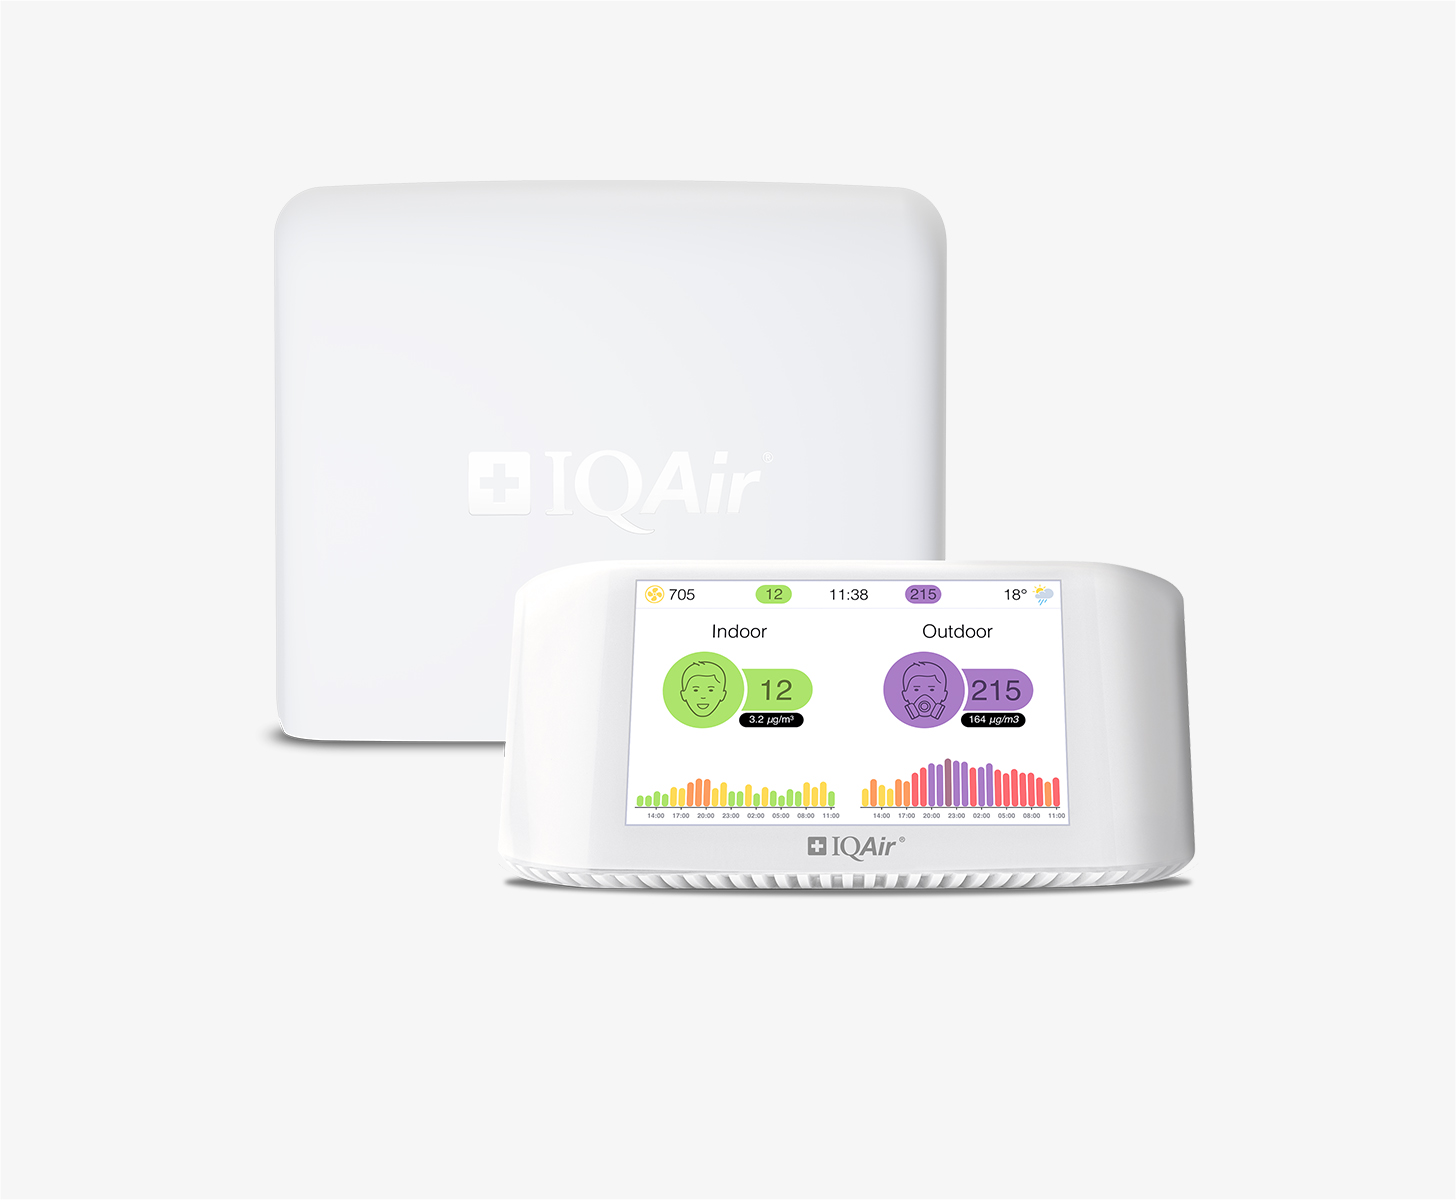
| Close your windows to avoid dirty outdoor air GET A MONITOR | |
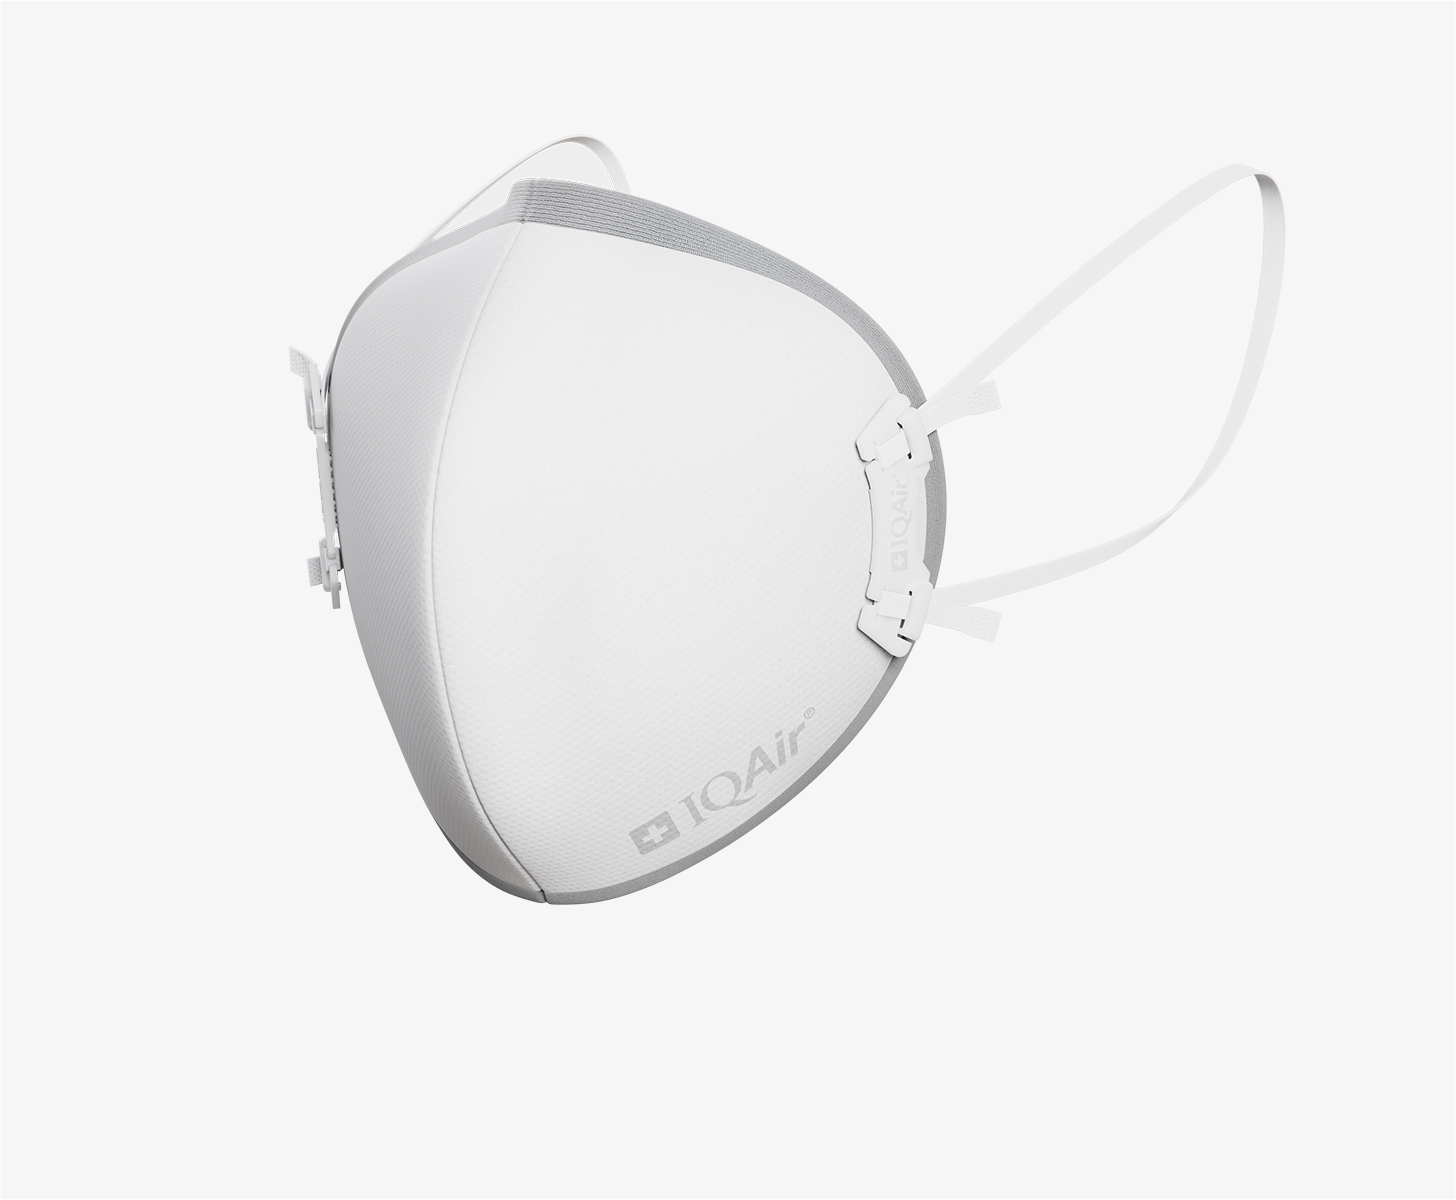
| Sensitive groups should wear a mask outdoors GET A MASK | |
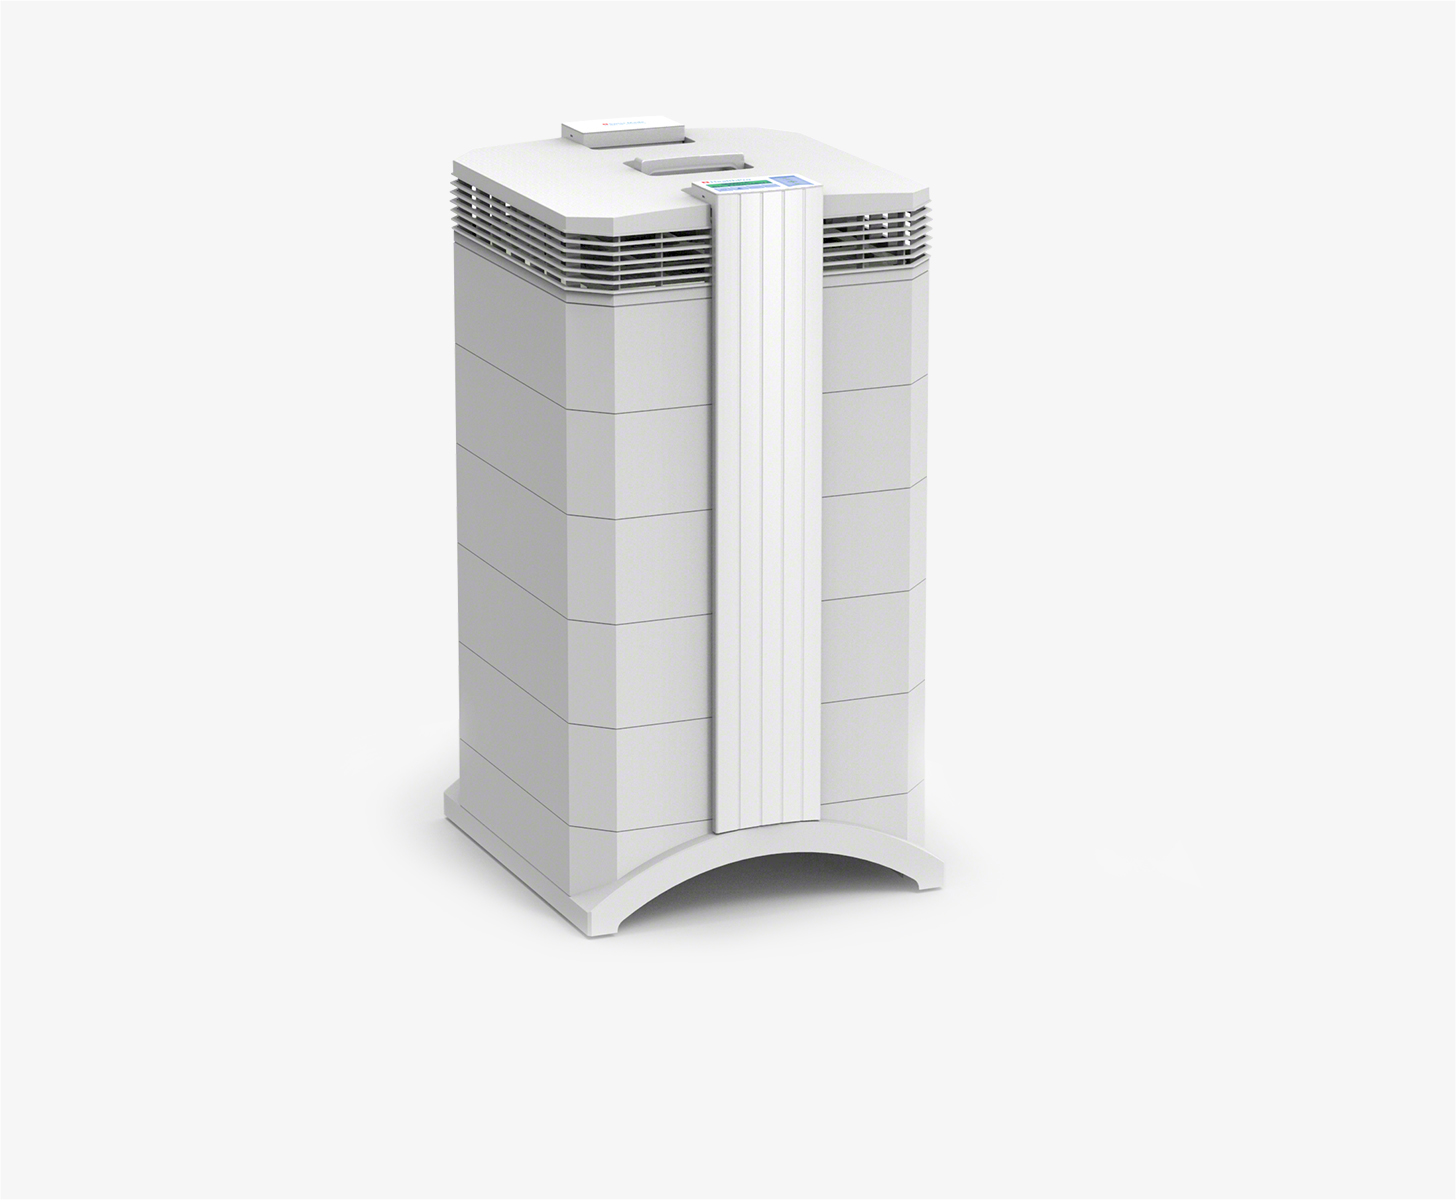
| Sensitive groups should run an air purifier GET AN AIR PURIFIER |
Become a contributor
Get an AirVisual Outdoor and contribute to collecting millions of data points for the Tehran map to track local air pollution
Understand air pollution and protect yourself
Tehran MAP AIR QUALITY ANALYSIS AND STATISTICS
What are the current pollution levels shown on the air quality map in Tehran?
Current and up-to-date air quality map readings change throughout the day, and as such, the air quality map, or air pollution map as it can also be referred to, can be checked over the day, with each day, week and month potentially having vastly different readings. Long-term reviews of such readings on the pollution maps will show that there may be average levels that are more common, specifically during certain times of the day as well as of the year. These are always subject to sudden change due to events such as fires or other major polluting issues.
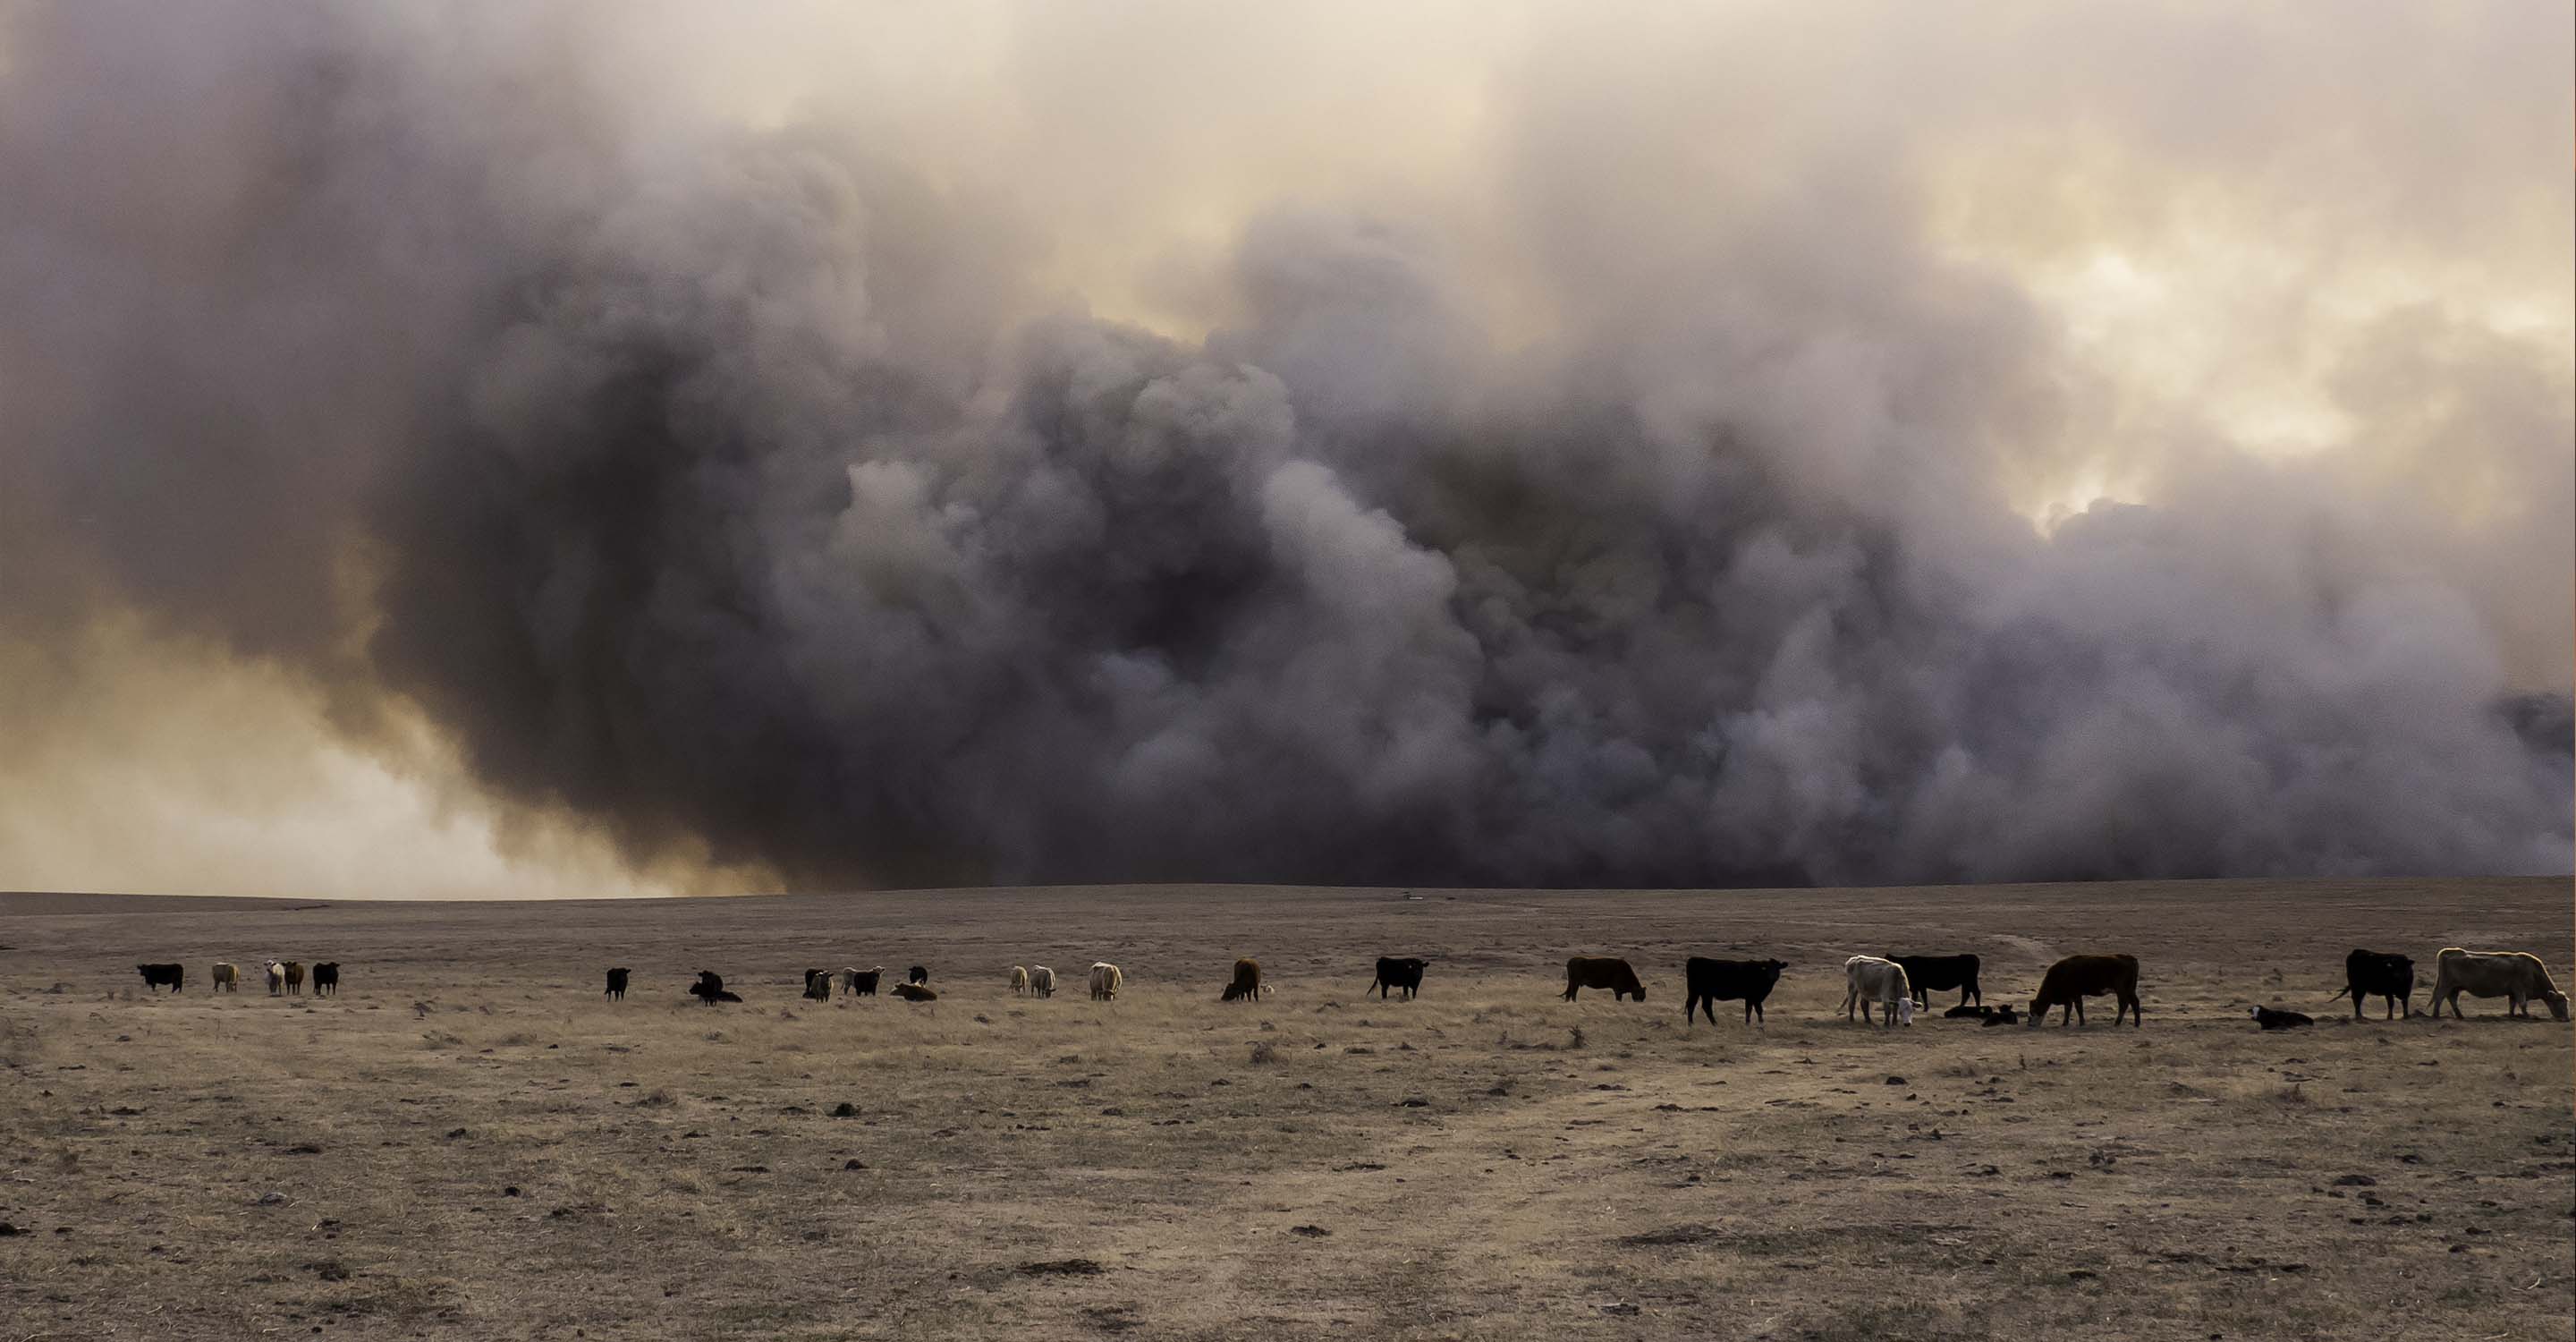
As of August 2022, when the following air quality readings were taken, pollution levels were quite high and indeed at levels significant enough to cause considerable harm to people living within Tehran. Some figures (which fluctuate and change constantly, and as such should be checked whenever possible on the air quality map above) were ones such as 'good' air quality readings to the west of 39 and 37, 'moderate' air quality readings of 61 and 87, as well as many unhealthy (color-coded as red on the map) readings of 150 and above, and a very serious reading of 204, classified as very unhealthy, with some active fires being shown nearby on the map to the aforementioned higher air pollution readings. These fires can have significant effects on the level of air cleanliness or lack thereof. When such fires abate, air quality levels may clear up on the may by a large amount, which highlights the need to stay up to date on the pollution readings shown on the air quality map for Tehran.
Is it possible to avoid health problems by using air quality maps in Tehran?
Health issues that can be potentially avoided by having more in-depth knowledge about areas of higher pollution within the city of Tehran, delivered to users by the air quality map above, are both wide-ranging and in some cases severe, particularly for those that are more susceptible to health conditions or those that are already in a poor state of health.
As is mentioned throughout the article, the air quality within Tehran remains quite bad for many months of the year, with many readings across the city and its extended areas falling into the higher pollution rating bracket, which shows up with varying darker colors on the map such as orange, red and in more severe cases, purple and maroon. Pollutants such as ultrafine particles, smoke clouds, haze and smog along with the other chemical compounds that go into forming the US AQI figure all fill the air within certain areas of the city. Factors such as lack of strong wind can cause accumulations to take place, driving up the US AQI figures on the pollution maps for Tehran. Some health issues, to name them for reference, that may be averted are ones that fall into the chronic obstructive pulmonary disease (COPD) bracket, namely asthma, bronchitis, pneumonia and emphysema. For those that are in poor health and have other comorbidities such as being overweight or smokers, conditions under the COPD bracket can have very serious effects and can turn from simple infections of the respiratory tract into potentially terminal illnesses amongst the elderly or those with poor levels of health and other harmful habits.
By referring to the readings on the air quality map and making sure that you are not in an area of Tehran that is currently experiencing a pollution spike, individuals may avoid these potential illnesses, along with reducing the risk of heart attacks, strokes, skin conditions, damage to reproductive health and even death, with many studies showing that excess pollution exposure can shorten life expectancy by a significant amount.
What do air quality map readings tell you about the air pollutants present in Tehran?
The air quality map for Tehran, and indeed every other city that is followed on the IQAir website, uses US AQI as its gauge for how polluted the air is. Whilst the map itself does not show the exact concentrations of the pollutants (which may be seen on the city page for Tehran, which also shows forecasts as well as pollution concentration levels), with a little bit of knowledge, users can view the air quality maps and understand the pollutants that they may be exposed to. US AQI itself is formed from carbon monoxide, nitrogen dioxide, sulfur dioxide, ozone, and PM2.5 and PM10. As such, when the pollution readings or US AQI readings on the air quality map are higher, it is far more likely that people in polluted areas, or areas that are experiencing a pollution spike, will be exposed to the above-mentioned pollutants, and may suffer the side effects related to these chemicals and their effects on the human body.
Are air pollution maps helpful for people living in Tehran?
As was mentioned in the first question, air quality maps in Tehran can help individuals in their daily life when they wish to avoid areas of high pollution, or keep an eye out for sudden spikes in the US AQI readings. Other ways in which they are helpful are in aiding certain decisions in day-to-day activities, which may include knowing when is the best time to undertake outdoor activities, particularly more strenuous ones such as jogging or other outdoor sports. If an individual runs through an area that has a higher level of pollution than shown on the air quality map, deep breaths can allow much higher quantities of extremely harmful pollutants to enter the lungs, and even into the bloodstream, causing a large number of health issues, some of which were also mentioned in the question above. Other ways in which air quality maps may be helpful are in determining a clear picture of which areas of Tehran have the worst levels of pollution, consistently throughout the year.
When air pollution maps show high readings over the course of the year, a multitude of sources are likely coming together to form these high readings, and as such, the US AQI reading is likely to stay high in this area year after year. This may include areas such as highways or even houses that are located near roads that have a high volume of traffic, particularly during rush hour times. Air quality map readings can also show elevated readings near industrial sites and other similar facilities (even construction sites and road repairs can contribute to the US AQI level shown on the air quality maps due to their release of many larger, or ultrafine fine particles into the atmosphere, not to mention fumes given off from heavy machinery). Decisions on where to live can also be made using the air quality maps, as families that have members with health issues, particularly when these health issues affect the lungs and heart, or the pulmonary or cardiac systems. Such people would benefit greatly from living in areas that are shown to be clean throughout the year on the air pollution maps. In the rare event of natural or industrial-related disasters, the air quality map will tend towards showing extremely high readings throughout the entire city, with the US AQI classifications shooting up to unhealthy ratings and beyond (all of which are color-coded for ease of recognition, either when referring to the city pages or the air quality map pages). As such, air pollution maps can help many different people living in Tehran to avoid excessive pollution exposure and allow them to make more informed decisions, due to the prevalence of the air quality monitoring facilities and the readings they are constantly feeding into the air quality maps data.
Tehran air quality data attribution
1Contributor
Government Contributor
1 Data source


